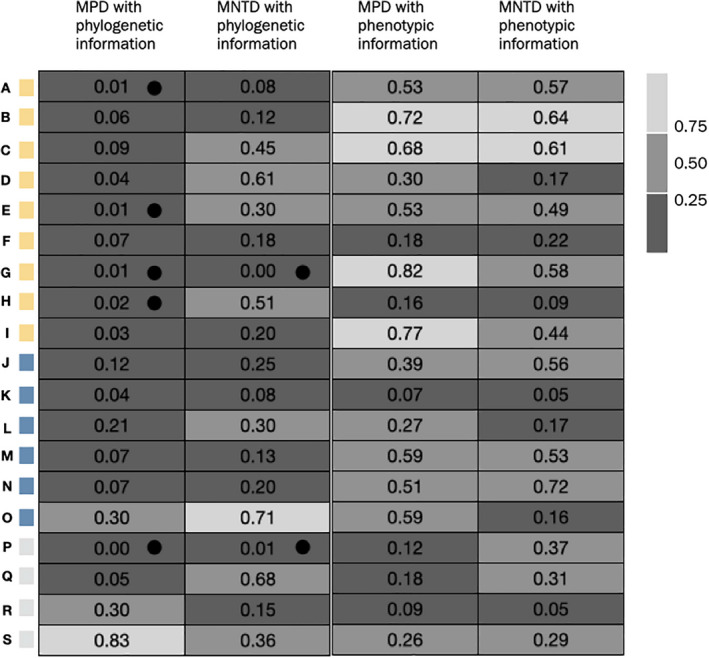
FIGURE 4.

Heatmap of p‐values for the 19 kipukas sampled at Craters of the Moon National Monument and Preserve, Idaho, USA for each phylogenetic and phenotypic diversity metric. The header of each column is the test that the p‐value in the cells refers to (mean pairwise distance, MPD and mean nearest taxon distance, MNTD). Colored squares at the left of the heatmap denote the kipuka letter and region (northern, central, and southern) as indicated in Figure 1. Darker gray colors represent lower p‐values and lighter gray colors represent higher p‐values. The standardized p‐value is noted in each cell. Additionally, a black circle within an individual cell represents a p‐value of less than .025 indicating significant support for phylogenetic or phenotypic clustering. A p‐value of more than .975 would indicate significant support for over‐dispersion
