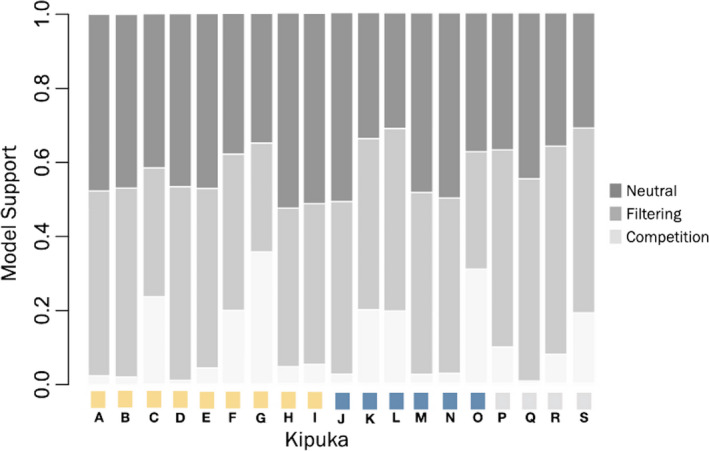
FIGURE 5.

Stacked bar plot of percent model support values for the 19 kipukas. Model support values indicated at left. Colored squares at bottom denote kipuka region (northern, central, and southern as indicated in Figure 1) at Craters of the Moon National Monument and Preserve, Idaho, USA. Shade of bar denotes community assembly model
