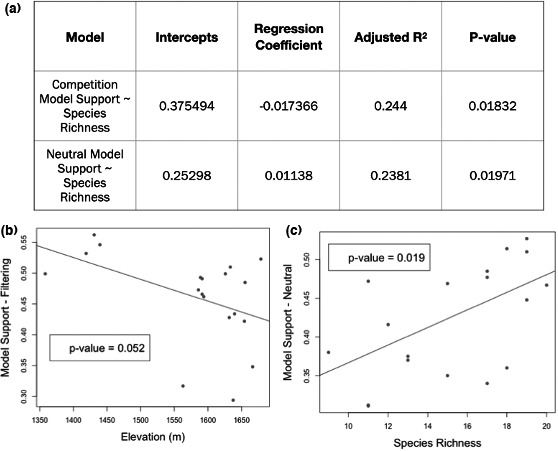
FIGURE 6.

Significant linear regression model results (α = 0.05). Top panel (a) includes significant (**) results for the model support (dependent variable) and factor of kipuka (independent variable). Split panels demonstrate (b) nearly significant (*) relationship negative relationship between elevation and model support for filtering and (c) significant (**) positive relationship between species richness and model support for neutrality. The rest of the linear regression model results can be found in Appendix S8
