
FIGURE 3.
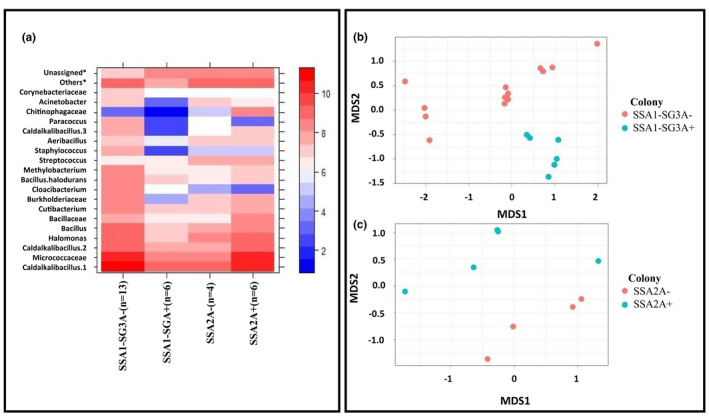
Bacterial composition (a, b and c) detected in whitefly colonies. Heat map of log‐reads of most abundant bacteria detected in whitefly colonies including those used in the crossing trials (a). Some of them were identified at the family level, whilst the majority were at the genus level (a). Bacterial composition was shown in nMDS graph for SSA1‐SG3 (b) and SSA2 (c). *others = all non‐abundant OTUs aggregated together, Unassigned = all OTUs not assigned with any OTU in the database