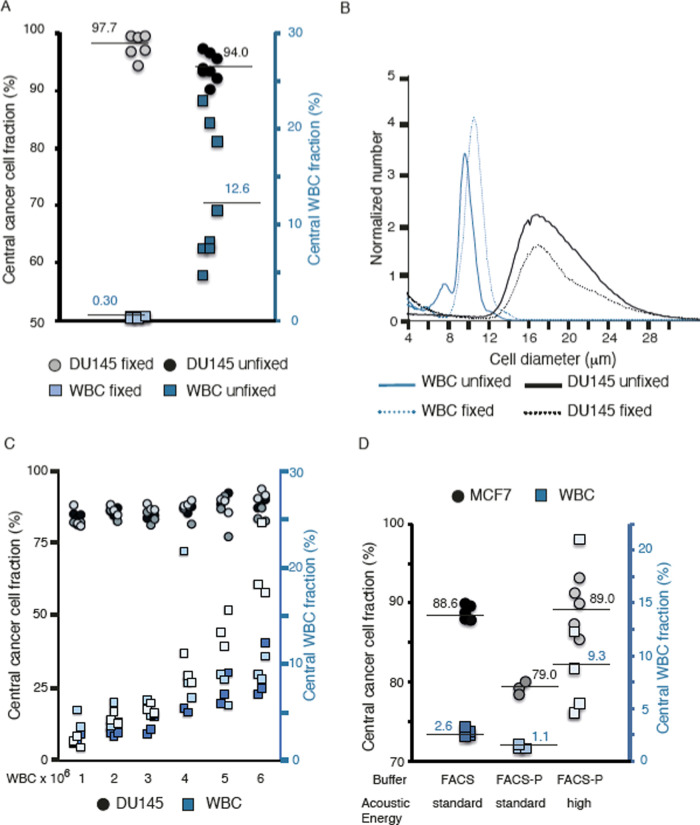
Figure 2.
Characterization for optimal cell separation by acoustophoresis. (A) Comparison of cell separation by acoustophoresis of PFA fixed vs unfixed DU145 cells and WBCs. (B) Cell size measurements by Coulter counter of PFA fixed and unfixed WBC and DU145 cells. The graph shows the result from a representative experiment out of the three performed experiments. (C) Central outlet cancer cell and WBC fractions vs total cell concentration. A series of samples with increasing concentrations of unfixed WBCs (1.0 × 10⁶ to 6.0 × 10⁶ mL–1) was run through the primary separation chip using a constant concentration of spiked unfixed DU145 cells (1.0 × 10⁴ mL–1). Three different experiments with n = 3 replicates were performed. Each experiment is color-coded in different shades of gray (DU145 cells) and blue (WBCs). (D) Comparison of unfixed cell separation: MCF7 cells (circles) and WBC (squares) in different buffers, FACS buffer vs FACS buffer containing Pluronic (FACS-P).

