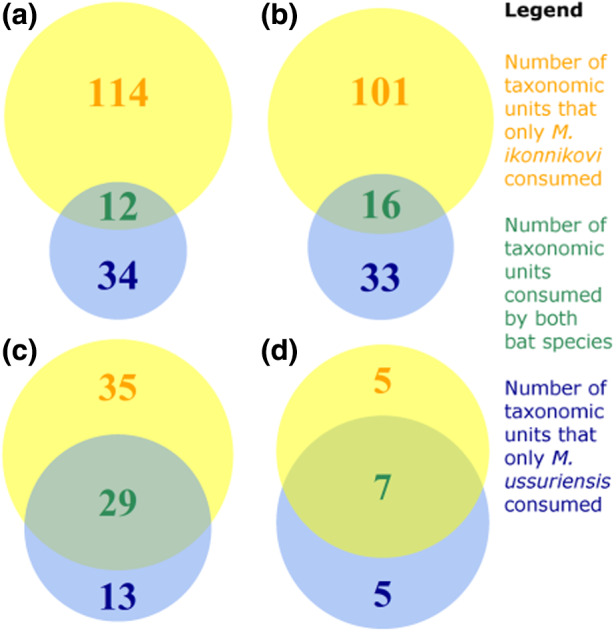
FIGURE 5.

Venn diagrams show the overlap of (a) prey species, (b) genera, (c) families, and (d) orders between the “core” diets of Murina ussuriensis and Myotis ikonnikovi. For this graph, only those taxonomic units were considered that were consumed by each bat species more than once
