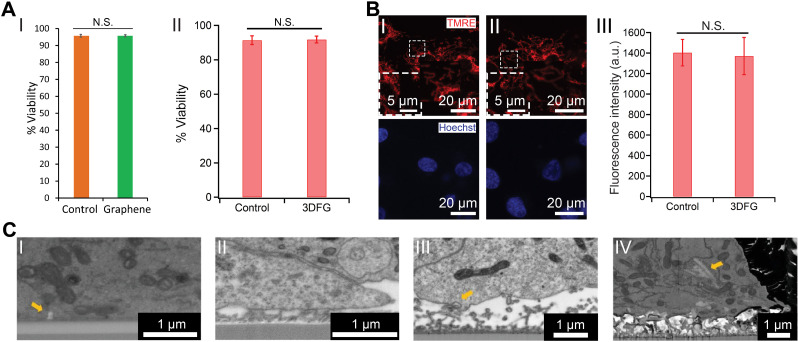
FIG. 4.
Graphene biointerfaces. (a) The effect of graphene nanostructures on the viability of cardiomyocytes. (I) Quantification of %Viability of hESC-CMs cultured on glass (orange) and graphene (green) substrates. N.S. denotes no statistically significant difference. Results are presented as mean ± SD (n = 3). Reproduced with permission from Rastogi et al., Cel. Mol. Bioeng. 11, 407–418 (2018). Copyright 2018 Biomedical Engineering Society.54 (II) %Viability of hESC-CMs cultured on Si/SiO2 control and 3DFG substrates. N.S. denotes no statistically significant difference. Results are presented as mean ± SD (n = 4). Reproduced with permission from Dipalo et al., Sci. Adv. 7(15), eabd5175 (2021). Copyright 2021 Author(s), licensed under Creative Commons Attribution-NonCommercial License 4.0.55 (b) TMRE assay performed on hESC-CMs at 6 days in vitro (DIV), cultured on (I) Si/SiO2 control and (II) 3DFG substrates. Red (TMRE) and blue (Hoechst) denote mitochondria and cell nuclei, respectively. (III) Relative fluorescence readout of the TMRE-labeled hESC-CMs cultured on Si/SiO2 control and 3DFG substrates. Results are presented as mean ± SD (n = 4). N.S. denotes no statistically significant difference. Reproduced with permission from Dipalo et al., Sci. Adv. 7(15), eabd5175 (2021). Copyright 2021 Author(s), licensed under Creative Commons Attribution-NonCommercial License 4.0.55 (c) Coupling between graphene nanostructures and electrogenic cells. SEM images (tilt 52°, backscattered electrons) of (I) 2D graphene-cell cross section, arrow identifies membrane invagination; (II) 3DFG-cell cross section; (III) NT-3DFG mesh-cell cross section, arrow identifies membrane wrapping at single wire. (IV) NT-3DFG vertically standing wires-cell cross section, arrow identifies a wire spontaneous penetration. Reproduced with permission from Mation et al., Adv. Mater. Interfaces 7(18), 2000699 (2020). Copyright 2020 Wiley-VCH GmbH.58

