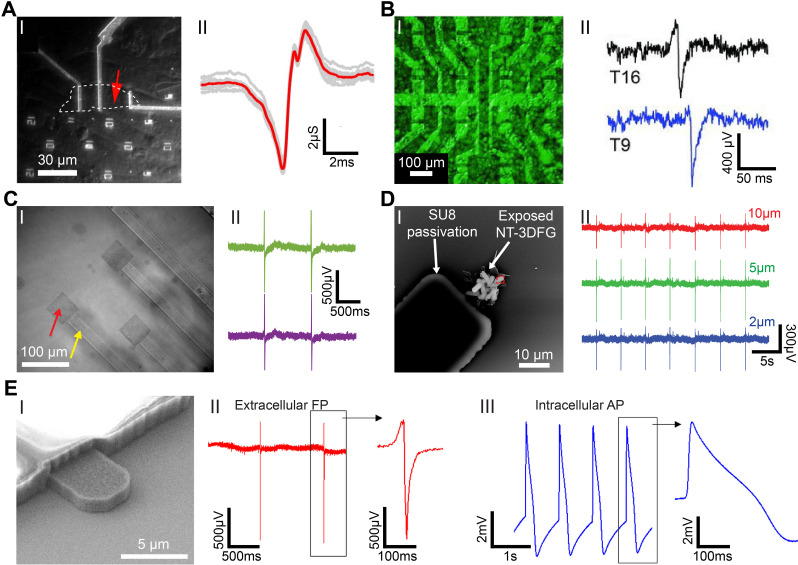
FIG. 5.
Graphene nanostructures for electrophysiology recordings. (a) Graphene FET (gFET) for electrical recording. (I) Optical microscope image of polydimethylsiloxane (PDMS)/cells interfaced with large flake gFET. Graphene flake outline is marked by white-dashed line; the measured device is marked by red arrow. (II) Recorded averaged peak (red) and raw data (gray traces) for the gFET and cell in (I). Reproduced with permission from Cohen-Karni et al., Nano Lett. 10(3), 1098–1102 (2010). Copyright 2010 American Chemical Society.62 (b) Graphene transistor arrays for recording action potentials from electrogenic cells. (I) Combination of an optical microscopy image of a transistor array and a fluorescence image of the calcein-stained cell layer on the same array. (II) Exemplary single spikes. The current response has been converted to an extracellular voltage signal. The upper spike resembles a capacitive coupling followed by the opening of voltage-gated sodium channels, whereas in the bottom one, the ion channels dominate over the capacitive coupling. Reproduced with permission from Hess et al., Adv. Mater. 23(43), 5045–5049 (2011). Copyright 2011 Wiley-VCH Verlag GmbH.61 (c) Graphene MEAs for electrical and optical measurements of human stem cell-derived cardiomyocytes. (I) Differential interference contrast (DIC) image of graphene MEAs fabricated on glass coverslip. (II) Representative recorded field potential traces using graphene MEAs. Reproduced with permission from Rastogi et al., Cel. Mol. Bioeng. 11, 407–418 (2018). Copyright 2018 Biomedical Engineering Society.54 (d) 3DFG ultra-MEAs for subcellular electrical recordings. (I) SEM image of 10 μm NT-3DFG-MEAs. (II) Representative recorded field potential traces using 10, 5, and 2 μm NT-3DFG ultra-microelectrodes. Reproduced with permission from Rastogi et al., Nano Res. 13, 1444–1452 (2020). Copyright 2020 Springer.67 (e) Intracellular action potential recordings from cardiomyocytes by ultrafast pulsed laser irradiation of fuzzy graphene MEAs. (I) SEM image of 5 μm 3DFG electrodes. (I) Representative extracellular field potential recording of hiPSC-CMs using 3DFG-MEA with 50 μm electrodes (n = 80 electrodes). (III) Representative intracellular action potential recording on 3DFG-MEA with 50-μm electrodes after optoporation (n = 70 electrodes). Reproduced with permission from Dipalo et al., Sci. Adv. 7(15), eabd5175 (2021). Copyright 2021 Author(s), licensed under Creative Commons Attribution-NonCommercial License 4.0.55

