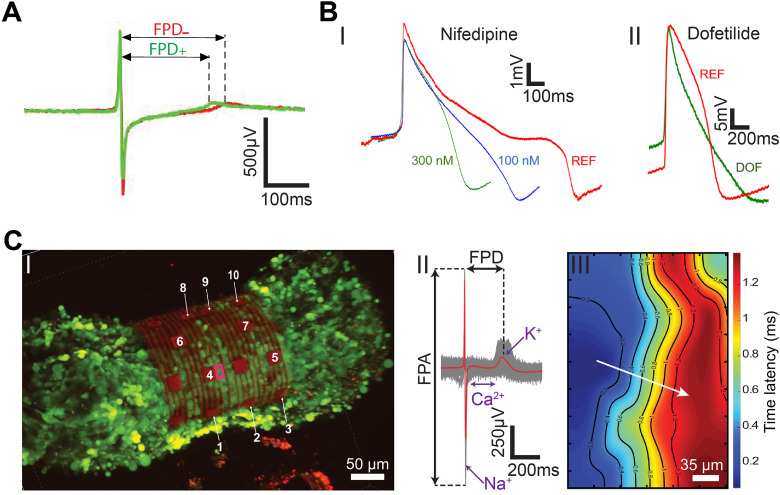
FIG. 6.
Electrophysiological investigations and mapping. (a) The effect of β-adrenergic receptor agonist on the extracellular electrophysiology using graphene MEAs. Averaged trace (70 peaks) before (red, −) and after (green, +) the application of β-adrenergic receptor agonist, isoproterenol. Reproduced with permission from Rastogi et al., Cel. Mol. Bioeng. 11, 407–418 (2018). Copyright 2018 Biomedical Engineering Society.54 (b) Intracellular electrophysiology investigations of the effect drugs on human-derived cardiomyocytes. (I) Representative cardiac action potentials before and after the administration of nifedipine at various concentrations. (II) Representative cardiac action potentials before and after the administration of 100 nM dofetilide (DOF). REF, reference signal in physiological conditions. Reproduced with permission from Dipalo et al., Sci. Adv. 7(15), eabd5175 (2021). Copyright 2021 Author(s), licensed under Creative Commons Attribution-NonCommercial License 4.0.55 (c) Mapping electrical signal propagation in 3D using the 3D-SR-BA. (I) A 3D confocal microscopy image of 3D cardiac spheroid labeled with Ca2+ indicator dye (Fluo-4, green fluorescence) encapsulated by the 3D-SR-BA. (II) Averaged field potential peak (red trace) and raw data (gray traces, n = 100 peaks recorded by channel 4). (III) 2D representation of the isochronal map of time latencies. White arrow represents average conduction velocity direction. Reproduced with permission from Kalmykov et al., Sci. Adv. 5(8), eaax0729 (2020). Copyright 2019 Author(s), licensed under a Creative Commons Attribution-NonCommercial License 4.0.33

