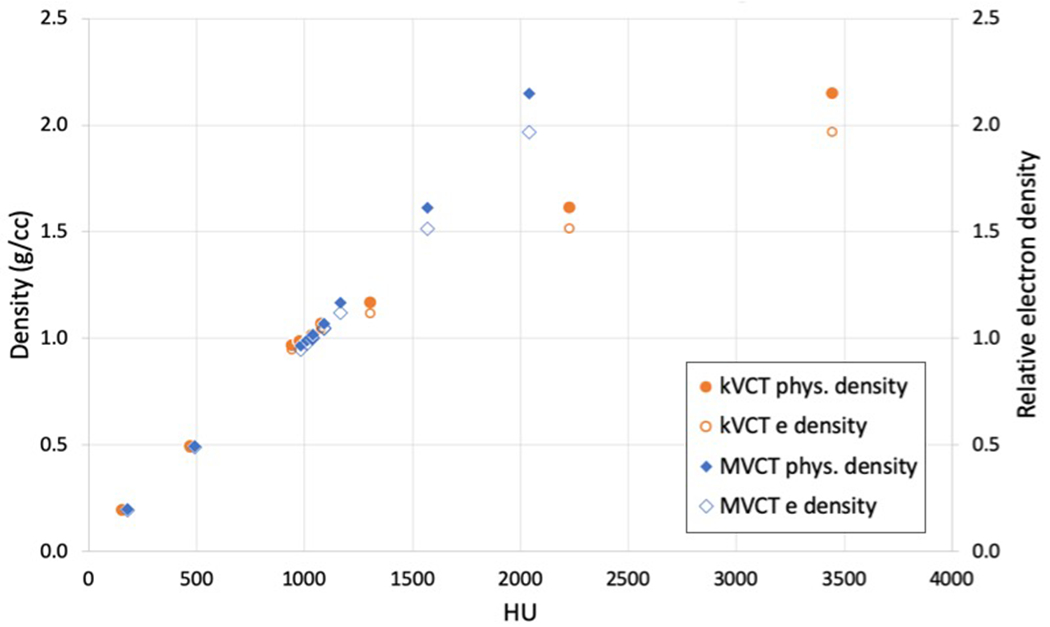
Figure 1:

Points which make up calibration curves of HU (kVCT and MVCT) versus physical density and relative electron density determined from scans of a tissue substitute phantom. Interpolations to these points were used to determine density values of tissue substitute phantoms from kVCT and MVCT images. The kVCT distribution forms the typical bilinear calibration curve while the MVCT distribution remains linear through the range of CT numbers due to the negligible effects of the photoelectric effect at MV energies.
