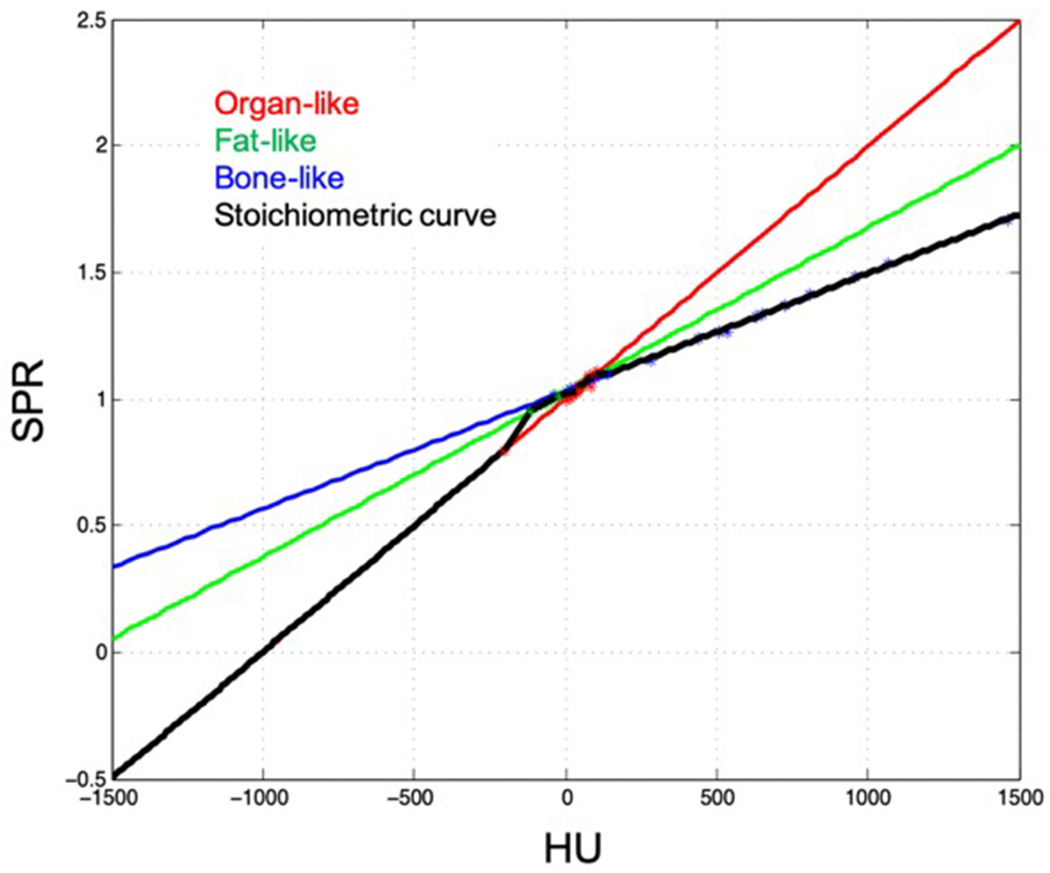
Figure 5:

A stoichiometric calibration curve (black line) which provides SPR from HU value was created for the kVCT scanner used in this study using the CIRS tissue surrogate phantom and parametric fits to literature values of organ-like (red line), fat-like (green line), and bone-like (blue line) human tissues.
