Figure 4.
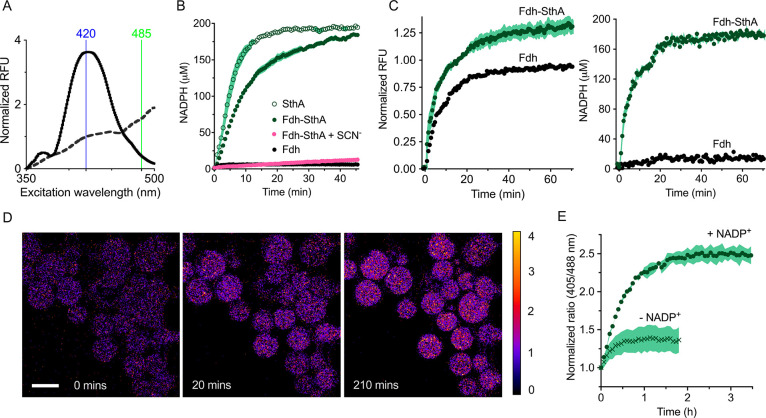
SthA-mediated transhydrogenation. (A) Fluorescent excitation spectrum of the NADPH sensor iNap1 before (dashed line) and after NADPH production (solid line) by the Fdh-SthA coupled reaction, with wavelengths used for excitation highlighted. The formed NADPH was quantified using the ratio in fluorescence at the excitation wavelengths of 420 and 485 nm. (B) Bulk solution NADPH formation. Empty circles depict the formation of NADPH from NADH mediated by SthA (0.08 μM SthA, 1.0 mM NADH, 0.2 mM NADP+, and 0.2 μM iNap1). Filled green circles represent NADPH formation using formic acid as an electron donor to reduce NAD+ to NADH which is subsequently used in the transhydrogenation reaction (0.25 μM Fdh, 1.0 mM NAD+, 0.08 μM SthA, 0.2 mM NADP+, and 0.2 μM iNap1). In the latter mixture, thiocyanate (SCN–) inhibits electron flow at the Fdh stage (pink symbols, 0.25 μM Fdh, 1.0 mM NAD+, 0.08 μM SthA, 0.2 mM NADP+, 0.2 μM iNap1, and 30 mM SCN–). Black circles: The conversion of NAD+ into NADH by Fdh is not detected by iNap1 (1.0 μM Fdh, 0.2 mM NAD+, and 0.2 μM iNap1). Each condition was repeated in biological quadruplicate (n = 4) and tested in buffer B. Error bars are reported as s.e.m. (C) Reduced cofactor detection in LUVs equipped with the iNap1 sensor (2.0 μM Fdh, 0.21 μM SthA, 1.0 mM NAD+, 0.2 mM NADP+, 1.0 μM iNap1, buffer C). At the excitation wavelength of 370 nm (left graph), the reduction of both nicotinamide cofactors can be observed without distinguishing NADPH from NADH. The ratio of the excitation wavelengths 420/485 permits the quantification of exclusively NADPH in the right-hand graph. The data sets from four independent experiments (n = 4) are displayed, and the error bars indicate the s.e.m. (D) Ratiometric time series of GUVs in the microfluidic traps with the encapsulated Fdh and SthA reactions and the sensor iNap1. The reactions were started by flowing in 5 mM external formate. Scale bar: 20 μm. (E) Ability to specifically sense NADPH formation in GUVs containing Fdh and SthA. The coupled reaction (2.0 μM Fdh, 1.0 mM NAD+, 0.21 μM SthA, 1.0 μM iNap1) can take place only in the presence of 0.5 mM NADP+ (green circles), when buffer I with 5 mM formate is flowed in the microfluidic chip (n = 114). Only a relatively small increase in the 420/485 ratio (green crosses) is visible in the absence of NADP+ (n = 109).

