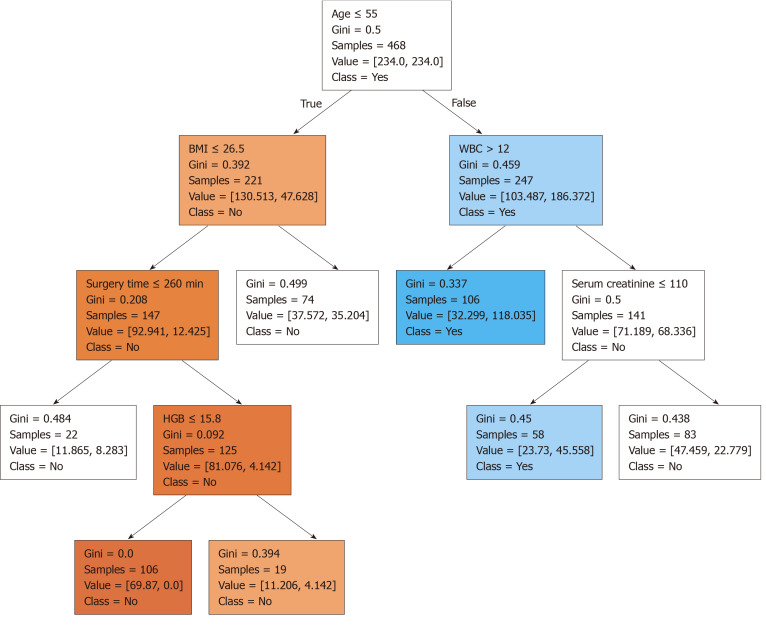
Figure 2.
Tree-like algorithm. Tree-like modelling can help analysis to reach the best prediction decision. Classification results for acute kidney injury (AKI) and non-AKI are shown in blue and orange, respectively. The smaller the Gini index, the darker the color. BMI: Body mass index; WBC: White blood cell; HGB: Hemoglobin.

