Abstract
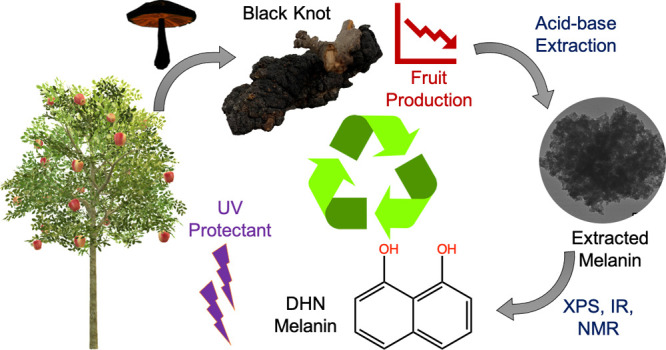
Melanin, a widespread pigment found in many taxa, is widely recognized for its high refractive index, ultraviolet (UV) protection, radical quenching ability, metal binding, and many other unique properties. The aforementioned characteristic traits make melanin a potential candidate for biomedical, separation, structural coloration, and space applications. However, the commercially available natural (sepia) and synthetic melanin are very expensive, limiting their use in various applications. Additionally, eumelanin has been the primary focus in most of these studies. In the present study, we demonstrate that melanin can be extracted from the pathogenic black knot fungus Apiosporina morbosa with a yield of ∼10% using the acid–base extraction method. The extracted melanin shows irregular morphology. Chemical characterization using X-ray photoelectron spectroscopy, infrared spectroscopy, and solid-state nuclear magnetic resonance spectroscopy reveals that the melanin derived from black knots is the less explored nitrogen-free allomelanin. Additionally, the extracted melanin shows broadband UV absorption typical of other types of melanin. Because of the wide availability and low cost of black knots and the invasive nature of the fungus, black knots can serve as an alternative green source for obtaining allomelanin at a low cost, which could stimulate its use as an UV light absorber and antioxidant in cosmetics and packaging industries.
1. Introduction
Melanin, a ubiquitous pigment that is found in many organisms ranging from bacteria to mammals, is a heterogeneous polymer comprised of phenolic and indolic polymeric compounds.1−15 Melanin can be broadly categorized into three different groups based on their structure and monomer units: eumelanin [made from 5,6-dihydroxyindole (DHI) and 5,6-dihydroxyindole-2-carboxylic acid (DHICA)], pheomelanin (containing 5-S-cysteinyldopa and 2-S-cysteinyldopa), and allomelanin (including pyomelanin, DHN-melanin, 1,4,6,7,9,12-hexahydroxyperylene-3,10-quinone-melanin, and catechol melanin), with eumelanin being the most common one.15,16 Melanin possesses many unique properties, including a high refractive index (RI) (∼1.8–2), broadband absorption spectrum ranging from ultraviolet (UV) to visible and infrared (IR) radiation, radical quenching ability, metal ion chelation, and high antioxidant activity.14,15,17−22 Indeed, melanin is thought of as the next generation material for its use in cosmetics, structural coloration, electronics, nanocomposites, and other applications, thereby increasing its demand.23−27 Therefore, large-scale production of melanin is desirable to meet this growing demand.
Over the years, efforts have been made to extract melanin from various natural sources and to synthesize melanin using different chemical precursors.6,10,12,14,16,28−38 So far, melanin has been extracted from cuttlefish (Sepia officinalis) inks,6,10,35 black fish crow feathers (Corvus ossifragus),14 wild turkey feathers (Meleagris gallopavo),14 black human hair,14,39 black garlic,35 black oat,12 various fungi (Cryptococcus neoformans, Aspergillus fumigatus, Pleurotus cystidiosus, Armillaria cepistipes, Auricularia auricula, and Colletotrichum lagenarium), and bacteria.16,28−31,33,34,36,38,40 Majority of these extracted melanins are eumelanins, only very few studies have isolated nitrogen-free allomelanin.12,16,41 Melanin has also been synthesized in the laboratory using dopamine, l-3,4-dihydroxyphenylalanine (DOPA), and DHN precursors.32,37 However, the commercially available natural and synthetic melanin (exclusively eumelanin) are very expensive, highlighting the need for alternative cheaper sources for the large-scale production of melanin.
Here, we explore the idea of using black knots as an alternative source for melanin. Black knot is a widespread disease in North America caused by the pathogenic ascomycetes fungus (Apiosporina morbosa) that infects the woody parts of plum, cherry, apricot, and chokecherry trees, mainly twigs and branches but occasionally trunks.42−45 Following the germination of spores, the fungus penetrates the host tree’s tissues and stimulates an abnormal tumor-like outgrowth, which matures and darkens over a period of reportedly 2 years into hard and woody black knots (∼0.5–2″ diameter and >1″ length).42,43 The disease results in poor fruit production, and in some cases, where most of the branches are infested, it may cause the death of the whole tree. Works have been done to control the black knot disease, where the knot-infested twigs and branches are pruned and burnt down to control the infection.46 However, to date, no report exists on extracting melanin from these readily available pathogenic black knots.
In the present study, we demonstrate that black knots are rich in melanin using Raman spectroscopy. The melanin is extracted from these fungal black knots using the acid–base extraction procedure, which is simple and easy to operate and aids in removing chitin typically present in the fungal cell wall.16,29 The morphology, chemistry, and UV-absorption ability of the extracted melanin is analyzed using scanning electron microscopy (SEM), transmission electron microscopy (TEM), X-ray photoelectron spectroscopy (XPS), Fourier transform infrared (FTIR) spectroscopy, solid-state nuclear magnetic resonance (ss-NMR) spectroscopy, and UV–Vis spectrophotometry. Our results indicate that the black knot fungal melanin has irregular morphology with chemistry similar to nitrogen-free allomelanin. Additionally, the extracted melanin shows a broadband UV–Vis absorption spectrum typical of other melanins, elucidating that the black knot waste could serve as a sustainable source for obtaining melanin at a lower cost for various commercial applications.23,24,26,27
2. Results and Discussion
2.1. Identification of Melanin in Black Knots and Its Extraction
Black knot disease, caused by the pathogenic fungus A. morbosa,42−46 results in a tumor-like outgrowth on branches of fruit trees, which darkens over time into hard-woody black knots (Figure 1a). Under the optical microscope and SEM, the knots appear as a cluster of ∼150 μm nodules (Figure 1b,c). The dark color of the knots could be taken as an indicator of melanin inside these knots. To further establish the existence of melanin, we use Raman spectroscopy, a noninvasive technique that has the potential to identify melanins.47−50Figure 1d shows a representative Raman spectrum of the black knot, which shows two characteristic melanin peaks at ∼1381 and ∼1593 cm–1 attributed to the vibrations of carbon atoms arranged in graphitic-like domains, also observed previously in the Raman spectra of synthetic DOPA melanin and natural melanin isolated from S. officinalis.47−50 The peak at 1381 cm–1 has been associated with the aromatic C–C linear stretching or aromatic C–N stretching of the indole structure, while the peak at 1593 cm–1 has been attributed to C=C bonds of the indole structure in the literature.47,48 Thus, our Raman spectral results confirm the presence of melanin in black knots, where melanin could be playing a role in virulence, photoprotection, metal ion sequestration, free radical scavenging, and mechanical strength.1,13 However, the exact function of melanin in these black knots remains unknown and will be explored in future studies.
Figure 1.
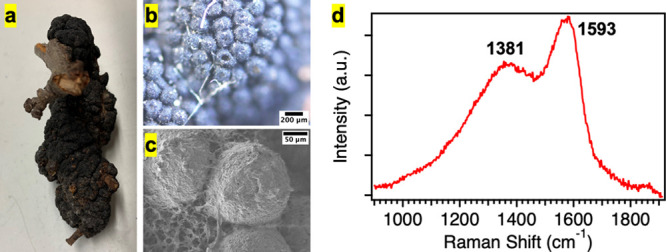
(a) Picture of a black knot (A. morbosa). (b, c) Optical and SEM images of the black knot fungus, where the knot appears as a cluster of ∼150 μm nodules. Scale bars are indicated on the images. (d) Representative Raman spectrum of the black knot showing characteristic melanin peaks at 1381 and 1593 cm–1.
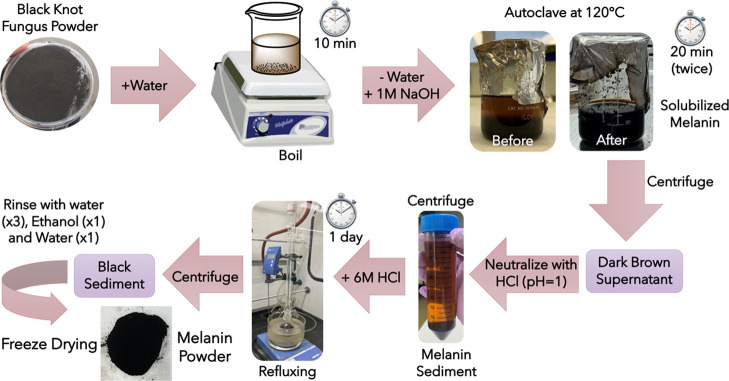
Black knots, being a fungus, are rich in chitin and it has been shown that it is extremely hard to completely get rid of polysaccharides associated with melanin in the fungal cell well using only enzymatic extraction.16,33,36,51 In addition, enzymatic extraction is a laborious process involving multiple steps and is not cost-effective. Here, we have chosen a harsher acid–base extraction process because it is relatively simple and easy to operate and therefore more cost-effective (Figure 2).1,12,16,28−30,33,35,36,51 However, it is possible that the acid–base extraction process may affect the final morphology and chemistry of extracted melanin.39,52 The details of the extraction method employed to extract melanin from black knots can be found in the Experimental Section. Briefly, it utilizes the property of melanin to be solubilized in highly basic conditions due to the deprotonation of various melanin functional moieties.12,16,28−30,35,36,53 Approximately 600 mg of melanin is obtained from a 6 g of starting material resulting in a considerable (10%) yield. This extracted melanin shows a strong EPR signal (Figure S1) indicating the existence of free radicals, consistent with the literature findings.33,34,37,51 Black knots are readily available at a cost of only 10 USD/lb, thus they could potentially serve as an alternative source for producing melanin at a cheaper cost. Additionally, the use of black knots to obtain melanin aids in recycling the farm waste, thereby greatly benefiting the environment. To understand the nature of melanin produced by the black knot fungus, we characterize its morphology using SEM and TEM, and its chemistry using a combination of spectroscopic techniques including XPS, FTIR, and ss-NMR.
Figure 2.
Schematic of the acid–base method utilized for the extraction and purification of melanin present in black knots.
2.2. Characterization of Extracted Melanin
2.2.1. Morphological Characterization Using SEM and TEM
Melanin extracted from black knots was observed using SEM (Figure 3a,b) to reveal its morphology relative to the original black knot. The extracted melanin shows irregular morphology with little resemblance to melanin from other biological sources including cuttlefish ink, bird feathers, and human hair.6,10,14,16,35 It is difficult to ascertain whether the melanin is present in this irregular shape itself in the black knot or the morphology gets affected as a consequence of the acid–base extraction procedure previously observed for human hair melanosomes.39 TEM analysis of the extracted melanin (Figure 3c,d) showed that the black knot melanin is composed of 20–30 nm sized units, consistent with the previous literature reports.33
Figure 3.
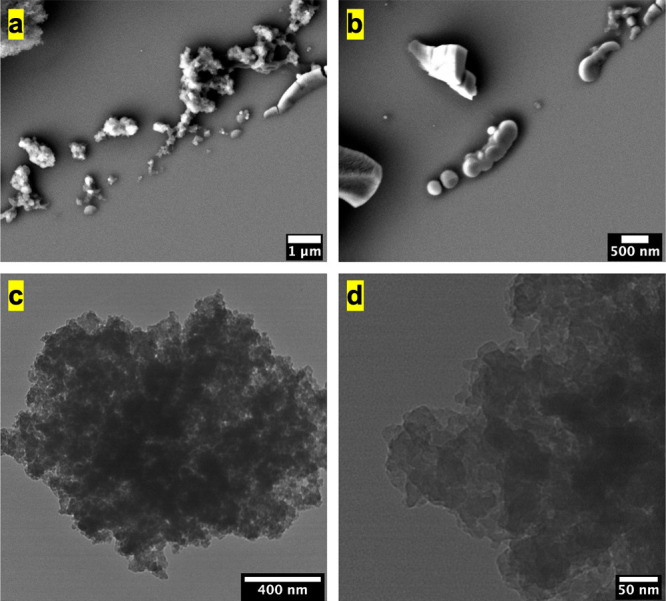
(a,b) SEM images of the melanin isolated from black knots. (c,d) TEM images of the extracted melanin. Scale bars are indicated on the images.
2.2.2. X-ray Photoelectron Spectroscopy
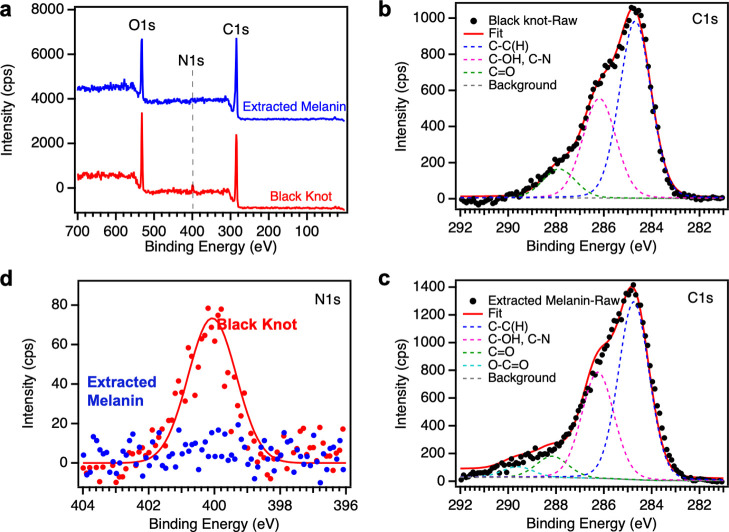
XPS is used to provide insight into the chemical composition of black knot powder (before extraction) and extracted melanin (after extraction). Figure 4a shows the survey scans for black knot powder and extracted melanin samples. The black knot survey scan shows predominantly carbon (71.4 ± 5.0%) and oxygen (24.7 ± 4.5%) with a small amount of nitrogen (3.5 ± 0.9%) similar to the atomic percentages of these elements in a chitin XPS spectrum collected in this study (Table S1 and Figure S2) and that reported by Kittle et al. for regenerated chitin films.54 The extracted melanin survey scan, on the other hand, shows only carbon (74.5 ± 0.9%) and oxygen (24.5 ± 1.2%) with a negligible amount of nitrogen. The absence of nitrogen in the extracted melanin hints toward the presence of nitrogen-free allomelanin in black knot fungus. As a control, we collected the XPS spectrum for well-characterized sepia melanin (Figure S2 and Table S1), which shows 10.6 ± 1.2% nitrogen consistent with the literature.14,16 To further confirm our results, we collected high-resolution carbon C 1s and nitrogen N 1s spectra (Figure 4b–d). After obtaining the raw data, we first corrected the C 1s spectra by shifting the largest peak to 285 eV and then fit the C 1s spectra using five peaks mentioned in the literature for melanin samples: C–C(H) (284.8 ± 0.2 eV, aliphatic and aromatic bonds taken together), C–OH/C–N (286.4 ± 0.2 eV), C=O (288 ± 0.2 eV), O–C=O (289.7 ± 0.2 eV), and a π–π* shake up at 290–292 eV.14,34 Both the black knot powder and extracted melanin samples’ C 1s spectra show predominant peaks corresponding to C–C(H) and C–O/C–N bonds and only minor C=O and O–C=O peaks (Table S2). This is contrary to the XPS results reported for eumelanin in the literature and sepia melanin in this study (Figure S2 and Table S2), suggesting that melanin extracted from the black knot powder is different from DHI/DHICA-based eumelanin.14,34 This is further corroborated by the absence of any nitrogen signal in the extracted melanin high-resolution N 1s spectra (Figure 4d). The absence of nitrogen in the extracted melanin hints toward the presence of nitrogen-free allomelanin. Because previous reports suggest that ascomycetes fungi such as the black knot fungus typically produce melanin using the pentaketide pathway, we expect the extracted melanin to be 1,8-DHN-based allomelanin.1,16
Figure 4.
(a) XPS survey scans for the black knot powder and extracted melanin. The spectra have been vertically offset for clarity. (b,c) High-resolution carbon C 1s spectra for the black knot powder and extracted melanin, respectively. The fit line and the individual bands from curve fitting have been indicated on the graph. (d) Comparison of high-resolution nitrogen N 1s spectra for both black knot powder and extracted melanin samples.
2.2.3. Fourier-Transform Infrared Spectroscopy
The IR spectra obtained for the black knot powder and extracted melanin are shown in Figure 5. The IR spectrum of black knot fungus powder (red line) before extraction shows strong peaks attributed to the C–O stretch (1034, 1069, and 1110 cm–1) and C–O–C stretch (1155 cm–1) reminiscent of the chitin and other polysaccharides present in the fungal cell wall (for details, see Figure S3).54,55 The broad peak between 3100 and 3500 cm–1 is assigned to the O–H or N–H stretch vibration in the chitin structure. Previous studies with fungal melanin suggest a strong association of melanin with chitin in the fungal cell wall along with mannoproteins, β-glucans, and phospholipids, therefore, the peaks at 1630 and 1660 cm–1 in the black knot IR spectrum can be assigned to the C=O stretch or amide I vibration.56 After the acid–base extraction, the intensity of peaks associated with chitin (1034, 1069, 1110, and 1155 cm–1) decreases significantly in the extracted melanin IR spectrum (blue line), suggesting successful removal of chitin during extraction. The peaks between 2850 and 2965 cm–1, assigned to the stretching vibration of aliphatic C–H groups, persist even after the acid–base extraction, suggesting the presence of covalently bound lipids.57 The IR spectrum for extracted melanin shows strong peaks at 1610 and 1707 cm–1 corresponding to the C=O stretch or aromatic C=C stretch vibrations of the quinonoid structures.34,37,41,58,59 The broadband between 1200 and 1400 cm–1 suggests the presence of C–O residues, which again resonates with the structural hypothesis proposed for DHN-based allomelanins (Figure S3) and our XPS results. The broad peak in the 3200–3400 cm–1 region is attributed to the OH stretch of the naphthalene ring. Overall, our FTIR data demonstrates a successful removal of chitin after the acid–base extraction, and a significant resemblance of extracted melanin to previously reported DHN-melanins.37,41,58,59 The detailed IR peak assignments for extracted melanin are provided in Table S3.
Figure 5.
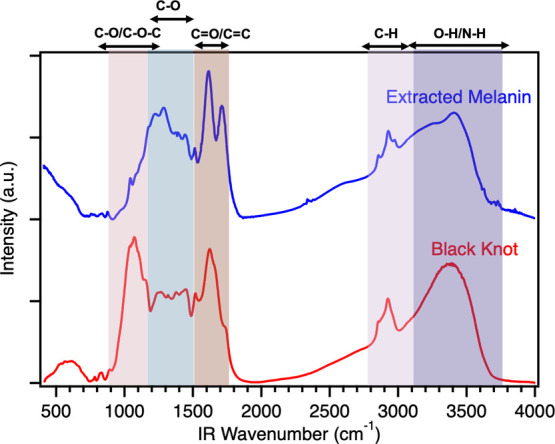
FTIR spectra of black knot (red line) and extracted melanin (blue line). The spectra have been vertically offset for comparison purposes.
2.2.4. Solid-State 13C NMR
To confirm the chemical structure deciphered using XPS and IR spectroscopies, we measured and compared the 13C spin echo (SE) and dipolar dephasing (DD) CP/MAS NMR spectra of black knot and extracted melanin using the Bruker AVANCE III 300 NMR (Figure 6). The SE NMR spectrum displays all kinds of carbon species (protonated and deprotonated) present in the sample, while the DD NMR spectrum displays nonprotonated and protonated carbons with weak dipolar coupling. Similar to XPS and IR, the 13C SE CP/MAS NMR spectrum before extraction shows strong chitin signals attributed to oxygenated aliphatic carbons (marked by green dashed lines): 22 (−CH3), 55 (C2), 60 (C6), 71 (C3), 74 (C5), 83 (C4), 104 (C1), and 173 (C=O), as seen in the literature.55,60 However, after extraction, the chitin peaks decrease significantly again confirming the removal of chitin using the acid–base extraction procedure. The extracted melanin 13C SE CP/MAS NMR spectrum shows a peak at 172 ppm (carbonyl peak, C=O), broad peaks spanning from 100 to 160 ppm (protonated and nonprotonated aromatic carbons in different chemical environments, for details, see Figure S4), and a peak around 20–40 ppm (mostly protonated aliphatic carbons).14,20 The presence of aliphatic signatures could indicate the presence of covalently bound lipids that are not removable using the acid–base extraction method, also seen in IR spectroscopy.56 Further, the broadening of the spectra is most likely caused by the intrinsic nature of melanin. Similar features were observed in the 13C CP/MAS NMR spectrum of extracted melanin acquired using a 750 MHz Magnex Scientific magnet and a Bruker spectrometer (Figure S5), except for a better signal-to-noise ratio. Our 13C CP/MAS NMR spectra for extracted melanin are similar to previously reported spectra for various fungal melanins and synthetic DHN allomelanin nanoparticles.33,37,51,56,61,62Figure 6 inset shows the 15N NMR spectrum of extracted melanin, which shows no signal, confirming the absence of nitrogen in the extracted melanin consistent with our XPS results.
Figure 6.
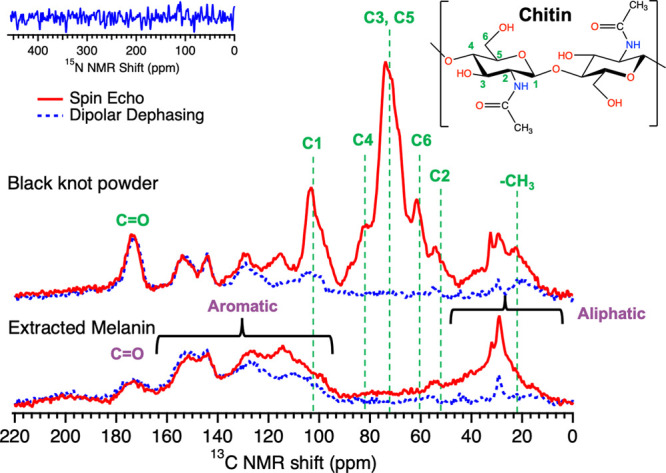
Comparison of the SE (red solid line) and DD (blue dashed line) 13C CP/MAS NMR spectra of black knot and extracted melanin acquired using Bruker AVANCE III 300 NMR. The SE NMR spectrum shows all protonated and nonprotonated carbon species present in the sample, while the DD NMR spectrum displays nonprotonated and protonated carbons with weak dipolar coupling. The chemical structure of chitin is shown with different numbers assigned to the carbon atoms corresponding to peaks observed in the NMR spectra of black knot powder. Inset shows the 15N ss-NMR spectrum of extracted melanin acquired using a 750 MHz Magnex Scientific magnet and a Bruker spectrometer. The absence of nitrogen signal highlights the chemistry of extracted melanin to be nitrogen-free allomelanin.
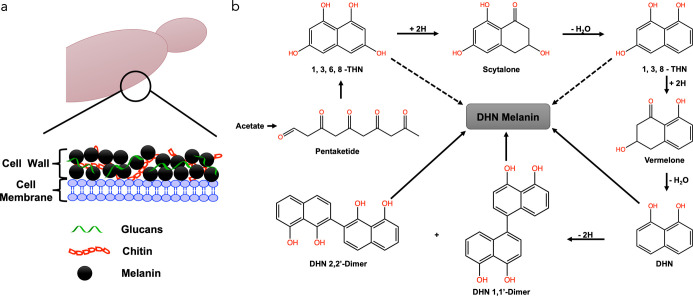
Our combined XPS, IR, and NMR spectroscopic data suggest that the melanin present in black knots is nitrogen-free allomelanin and is strongly associated with chitin in the fungal cell wall. Based on the previous literature reports on fungal melanin, we propose the model shown in Figure 7a for the A. morbosa fungal cell wall, where melanin exists in the cell wall along with chitin, glucans, and lipids.51 Furthermore, we believe that the extracted melanin is 1,8-DHN based on the expectation that ascomycetes fungi typically synthesize melanin from the pentaketide pathway using 1,8-DHN precursor (Figure 7b).1,16 In this pathway, pentaketide is first converted into 1,3,6,8-tetrahydroxynapthalene (1,3,6,8-THN), which undergoes reduction to produce scytalone. This intermediate is then converted into 1,3,8-trihydroxynapthalene (1,3,8-THN) by a dehydration step, followed by its reduction to vermelone and subsequent dehydration to 1,8-DHN. Two of these DHN molecules combine to produce either a 1,1′-dimer or a 2,2′-dimer. Both of these dimers are eventually converted into melanin granules, as shown in Figure 7a.
Figure 7.
(a) Schematic showing the major constituents in melanized ascomycetes fungus (A. morbosa) also known as black knot. (b) Biosynthetic pathway of DHN-melanin from pentaketide based on the previous literature.1,37
2.2.5. UV–Vis Spectrophotometry
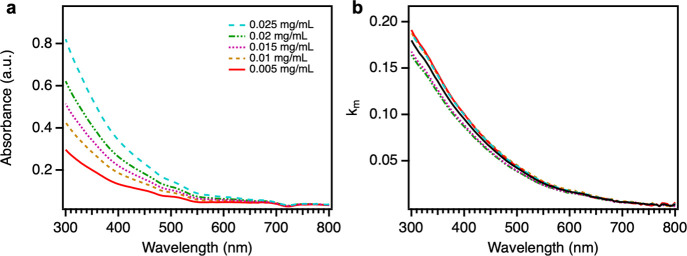
The DHN-based allomelanin extracted from black knots shows a broadband absorption of light from 300 to 800 nm (Figure 8a), which is a typical absorption profile of most melanins.14,16 The absorbance is high in the UV region and gradually decreases as the wavelength increases because the complex conjugated structure of melanin can absorb UV photons and blue solar light. As the concentration of extracted melanin increases, the absorbance increases as illustrated in Figure 8a. The imaginary part of RI of extracted melanin (km) is calculated using eqs 1–4 (for details, see Experimental Section) using the absorbance data for the solutions of extracted melanin. The km values calculated from different concentration solutions are similar, consistent with expectations from the theory. Our measured km values for black knot-extracted allomelanin are similar to those reported by Li et al. for polydopamine and poly(dopamine-l-DOPA) thin films measured using ellipsometry.22
Figure 8.
(a) UV–Vis absorbance spectra of extracted melanin in aqueous NaOH solutions with different concentrations (given in mg/mL). (b) Imaginary part of the RI of extracted melanin (km), calculated from the UV–Vis absorbance data, as a function of wavelength. Different colored curves are for each concentration [color scheme is the same as shown in (a)] and the black curve is the averaged value of all five concentrations.
3. Conclusions
In summary, we successfully report the extraction of melanin from pathogenic black knots via the acid–base extraction procedure with a yield of 10%. Black knots offer advantages over other melanin sources in terms of cost, scalability, and sustainability. The extracted melanin shows an irregular morphology different from other natural melanins. Chemical analysis using XPS suggests that the extracted melanin is allomelanin confirmed by the absence of nitrogen in survey and high-resolution N 1s XPS scans of extracted melanin. Furthermore, characterization using IR and ss-NMR confirms the chemical nature of extracted melanin. The extracted melanin presents a broadband monotonic absorption of light and thus could be applied for UV protection in various applications.
4. Experimental Section
4.1. Materials
Black knots (A. morbosa) were obtained from a local farm in Ohio. Reagent grade sodium hydroxide (NaOH), hydrochloric acid (37% HCl by weight), and ethanol, procured from Sigma-Aldrich, were used for melanin extraction. All glassware used was cleaned using a base bath followed by thorough rinsing with ultrapure water (18.2 MΩ cm, Millipore filtration system with deionizing and organic removal columns).
4.2. Melanin Extraction
Melanin was extracted from black knots using the literature reported acid–base extraction procedure with slight adjustments.1,4,6,16,29,30,39,63,64 Black knots were scraped for the black outer part leaving the internal wooden part intact. The black part (coarse grains, ∼6 g) was ground into a fine powder using a ball mill before boiling in water at 120 °C for 10 min to kill any bacteria and remove dust particles. After discarding water from the previous step, the left-over black residue was mixed with 250 mL of 1 M NaOH and autoclaved at 120 °C for 20 min twice. This step aids in solubilizing the melanin in aqueous media, which was then separated in the supernatant phase from the remaining components by centrifugation at 8000 rpm for 15 min. Afterward, a concentrated HCl solution (37%) was added to the supernatant until pH equals 1 to allow the precipitation of melanin. The precipitated melanin was then collected by centrifugation at 8000 rpm for 15 min, which was further refluxed in the concentrated HCl solution (37%) for 1 day to hydrolyze the proteins, carbohydrates, and lipids associated with melanin. The final product was rinsed with ultrapure water (three times), ethanol (once), and water (once) again before lyophilizing it to obtain the final melanin powder.
4.3. Morphological Characterization
The morphology of raw black knots and extracted melanin was analyzed using optical light microscopy (Olympus BX-51) and SEM (JEOL-7401) with an acceleration voltage of 3–4 kV and a current of 20 μA. Raw black knots were ground into fine powder to observe their morphology. To analyze the morphology of extracted melanin, a small amount of it was suspended in water and then drop cast on a clean silicon wafer placed on the hot plate to allow quick water evaporation. The silicon wafer was subsequently adhered to an aluminum stub using a double-sided carbon tape to observe the morphology of melanin. A small amount of the extracted melanin aqueous suspension was also drop cast on the TEM grid to analyze its morphology using TEM (JEM-1230, JEOL Ltd).
4.4. Chemical Characterization
4.4.1. Raman Spectroscopy
Raman spectra of the black knot powder were obtained using the Renishaw inVia Raman confocal microscope with a 514 nm excitation laser and 50× objective lens. Spectra were collected over the range 1000–2000 cm–1 and averaged over at least three accumulations, each with an exposure time of 30 s. At least three independent measurements were done to ensure reproducibility of results.
4.5. X-ray Photoelectron Spectroscopy
XPS scans were collected for the black knot powder and extracted melanin using the PHI 5000 VersaProbe III Surface Analysis instrument from Physical Electronics interfaced with a computer equipped with ULVAC MultiPak software for operation and data analysis. Spectra were recorded using a microfocused Al Kα radiation (25 W, 15 kV, and 100 μm) with a probe depth of 10–12 nm. A base pressure less than 2 × 10⁻⁸ Pa and an operating pressure of ∼2 × 10⁻⁶ Pa were used. The 117.4 eV pass energy was used for survey scans (0–1400 eV) and the pass energy of 11.75 eV was used for the high-resolution C 1s (278–292 eV) and N 1s scans (394–406 eV). The peak fitting of high-resolution scans was carried out using a standard least-squares algorithm on Multipak software provided by PHI VersaProbe and XPS Tool (XPST) provided by Wavemetrics. Because no significant differences were observed in the obtained results from the two software packages, we averaged the numbers to report the percentages of different types of carbon bonds (Table S2). The C 1s peak is shifted because of the surface charge neutralization, which is corrected by manually shifting the peak to 284.8 eV, the binding energy. Fitting was done using a Gaussian–Lorentzian (90:10) function with a Shirley background subtraction.
4.5.1. FTIR Spectroscopy
IR spectra were acquired using the Thermo Scientific Nicolet iS50 Fourier transform infrared spectrometer. The black knot (or the extracted melanin) powder (approx. 1–2 mg) was ground with 160 mg of potassium bromide (KBr, FTIR grade, Sigma-Aldrich) using an agate mortar and pestle. The fine ground powder was compressed to a semi-transparent pellet using a die and hydraulic press (OMEGA CN9000). The formed pellets were placed in the vacuum oven at room temperature overnight to remove any adsorbed water. The pure KBr pellet was used as the background for obtaining the IR spectra of samples in the transmission mode. An average of 32 scans were collected with a resolution of 4 cm–1 in the 400–4000 cm–1 range.
4.5.2. Solid-State NMR
The ss-NMR spectra were acquired using two different instruments. In the first case, CP/MAS spectra were collected using the Bruker AVANCE III 300 NMR with 13C and 1H resonance frequencies of 75.6 and 300.1 MHz, respectively. The samples (black knot and extracted melanin powders) were packed in 4 mm diameter cylindrical rotors. The magic-angle spinning (MAS) rate for SE and DD experiments was 12 kHz. 1H spin–lattice relaxation time in the laboratory frame (τ1H) was measured by the inversion-recovery method (180-τ-90°) and was determined to be 204.8 and 512.5 ms for black knot and extracted melanin powders, respectively. In 13C CP/MAS experiments, 1H 90◦ pulse length, CP contact time, and recycle delay were set to 3.3 μs, 2 ms, and 2 s, respectively. Two-pulse phase-modulated decoupling frequency was set to be 75.8 KHz (180◦ pulse length of 6.6 μs) to detect 13C signals. The 13C chemical shift was calibrated externally based on the methine peak of adamantane at 29.46 ppm.
In the second case, ss-NMR spectra were recorded for the extracted melanin using a 750 MHz Magnex Scientific magnet and a Bruker spectrometer at 280 K. Powdered extracted melanin sample ∼28 mg) was packed in a 3.2 mm diameter Bruker rotor. 1D 13C CP spectrum was acquired with 16.4k scans and a recycle delay of 3 s. The CP contact times were optimized to 0.9 ms, with a 1H decoupling frequency of 83 kHz and a spinning frequency of 13.5 kHz. The 1D 15N CP spectrum was acquired with 1.1 ms contact time, 83 kHz 1H decoupling frequency, 16.5k scans, 3 s recycle delay, and 17.5 kHz spinning frequency. Chemical shifts for 13C NMR were referenced to the reported values of adamantane at 38.5 and 29.5 ppm. Chemical shift values for 13C and 15N are reported in parts per million (ppm) relative to these referenced values.
4.6. UV–Vis Spectrophotometry
UV–Vis absorption spectra were collected using an Agilent Cary 60 UV–visible spectrophotometer in the range of 300–800 nm. The extracted melanin was dissolved in 1 M NaOH at a concentration of 1 mg/mL. Subsequently, different dilutions with blank 1 M NaOH were made to collect the UV–Vis absorption spectra for 0.005, 0.01, 0.015, 0.02, and 0.025 mg/mL solutions, that obey the Beer–Lambert law.35,59 The same NaOH solution was used as a control. The collected UV–Vis absorbance data was used to calculate the imaginary part of the RI (km) of the extracted melanin using the following procedure.
The Beer–Lambert law relates transmission (T(λ)) to the extinction coefficient (u(λ)) and the optical length (d) using the expression given in eq 1. The electromagnetic wave theory further relates the extinction coefficient (u(λ)) to the imaginary part of the RI of a solution (keff) using eq 2. Equations 1 and 2 can be combined to provide a direct relationship between keff and transmission T(λ), as shown in eq 3. Because the absorption of 1 M NaOH solution is negligible in the wavelength range from 300 to 800 nm, the measured absorption of extracted melanin solutions results solely from the extracted melanin. Thus, km can be determined from keff by normalizing it with the volume fraction of the extracted melanin (Vm), as given in eq 4.
| 1 |
| 2 |
| 3 |
| 4 |
Acknowledgments
The authors would like to thank Dr. Andrew Knoll for helping with XPS measurements, Zepeng Yang for helping with TEM measurements, Chinnapatch Tantisuwano and Yen-Ming Tseng for helping with acid reflux and lyophilization, and Dr. Sudha Chakrapani and Dr. Eric Gibbs for helping with EPR measurements. The authors would like to thank Mario Echeverri, Anvay Patil, and Dr. Dharamdeep Jain for their suggestions in improving the manuscript. This project was supported by the Air Force Office of Scientific Research under the Multi-University Research Initiative (MURI) grant (FA9550-18-1-0142).
Supporting Information Available
The Supporting Information is available free of charge at https://pubs.acs.org/doi/10.1021/acsomega.1c05030.
EPR spectrum of melanin extracted from black knots, XPS survey scans and high resolution scans for chitin, 1,8-DHN monomer, and sepia melanin, comparison of FTIR spectra of black knot powder and shrimp chitin, and extracted melanin and 1,8-DHN monomer, 13C chemical shift predictions for intermediates in the DHN biosynthetic pathway, 13C ss-NMR spectrum of melanin extracted from black knot fungus, atomic percentage (% ± SD; n≥2) of different elements detected with XPS, percentage (% ± SD, n=2) of different types of carbon bonds, and assignment of signals in the FTIR spectrum of extracted melanin (PDF)
Author Present Address
# Department of Chemical and Biomolecular Engineering, University of Notre Dame, Notre Dame IN 46556, United States
Author Contributions
⊥ S.S. and K.Z.H. contributed equally to the work.
The authors declare no competing financial interest.
Supplementary Material
References
- Bell A. A.; Wheeler M. H. Biosynthesis and Functions of Fungal Melanins. Annu. Rev. Phytopathol. 1986, 24, 411–451. 10.1146/annurev.py.24.090186.002211. [DOI] [Google Scholar]
- Rakoczy L.; Panz T. Melanin Revealed in Spores of the True Slime Moulds Using the Electron Spin Resonance Method. Acta Protozool. 1994, 33, 227–231. [Google Scholar]
- Pionka P. M.; Rakoczy L. The Electron Paramagnetic Resonance Signals of the Acellular Slime Mould Physarum Nudum Plasmodia Irradiated With White Light. Curr. Top. Biophys. 1997, 21, 83–86. [Google Scholar]
- Butler M. J.; Day A. W. Fungal Melanins: A Review. Can. J. Microbiol. 1998, 44, 1115–1136. 10.1139/w98-119. [DOI] [Google Scholar]
- Loganathan P.; Kalyanasundaram I. The Melanin of the Myxomycete Stemonitis herbatica. Acta Protozool. 1999, 38, 97–103. [Google Scholar]
- Liu Y.; Simon J. D. The Effect of Preparation Procedures on the Morphology of Melanin From the Ink Sac of Sepia officinalis. Pigm. Cell Res. 2003, 16, 72–80. 10.1034/j.1600-0749.2003.00009.x. [DOI] [PubMed] [Google Scholar]
- Liu Y.; Simon J. D. Isolation and Biophysical Studies of Natural Eumelanins: Applications of Imaging Technologies and Ultrafast Spectroscopy. Pigm. Cell Res. 2003, 16, 606–618. 10.1046/j.1600-0749.2003.00098.x. [DOI] [PubMed] [Google Scholar]
- Langfelder K.; Streibel M.; Jahn B.; Haase G.; Brakhage A. A. Biosynthesis of Fungal Melanins and Their Importance for Human Pathogenic Fungi. Fungal Genet. Biol. 2003, 38, 143–158. 10.1016/s1087-1845(02)00526-1. [DOI] [PubMed] [Google Scholar]
- Krzywda A.; Petelenz E.; Michalczyk D.; Płonka P. M. Sclerotia of the Acellular (True) Slime Mould Fuligo septica as a Model to Study Melanization and Anabiosis. Cell. Mol. Biol. Lett. 2008, 13, 130–143. 10.2478/s11658-007-0047-5. [DOI] [PMC free article] [PubMed] [Google Scholar]
- Magarelli M.; Passamonti P.; Renieri C. Purification, Characterization and Analysis of Sepia Melanin From Commercial Sepia Ink (Sepia Officinalis). J. Vet. Med. Zootech. 2010, 5, 18–28. [Google Scholar]
- Nosanchuk J. D.; Stark R. E.; Casadevall A. Fungal Melanin: What do we Know About Structure?. Front. Microbiol. 2015, 6, 1463. 10.3389/fmicb.2015.01463. [DOI] [PMC free article] [PubMed] [Google Scholar]
- Varga M.; Berkesi O.; Darula Z.; May N. V.; Palágyi A. Structural Characterization of Allomelanin From Black Oat. Phytochemistry 2016, 130, 313–320. 10.1016/j.phytochem.2016.07.002. [DOI] [PubMed] [Google Scholar]
- Cordero R. J. B.; Casadevall A. Functions of Fungal Melanin Beyond Virulence. Fungal Biol. Rev. 2017, 31, 99–112. 10.1016/j.fbr.2016.12.003. [DOI] [PMC free article] [PubMed] [Google Scholar]
- Xiao M.; Chen W.; Li W.; Zhao J.; Hong Y.; Nishiyama Y.; Miyoshi T.; Shawkey M. D.; Dhinojwala A. Elucidation of the Hierarchical Structure of Natural Eumelanins. J. R. Soc. Interface 2018, 15, 20180045. 10.1098/rsif.2018.0045. [DOI] [PMC free article] [PubMed] [Google Scholar]
- D’Alba L.; Shawkey M. D. Melanosomes: Biogenesis, Properties, and Evolution of an Ancient Organelle. Physiol. Rev. 2019, 99, 1–19. 10.1152/physrev.00059.2017. [DOI] [PubMed] [Google Scholar]
- Pralea I.-E.; Moldovan R.-C.; Petrache A.-M.; Ilieş M.; Hegheş S.-C.; Ielciu I.; Nicoară R.; Moldovan M.; Ene M.; Radu M.; et al. From Extraction to Advanced Analytical Methods: The Challenges of Melanin Analysis. Int. J. Mol. Sci. 2019, 20, 3943. 10.3390/ijms20163943. [DOI] [PMC free article] [PubMed] [Google Scholar]
- Stavenga D. G.; Leertouwer H. L.; Osorio D. C.; Wilts B. D. High Refractive Index of Melanin in Shiny Occipital Feathers of a Bird of Paradise. Light Sci. Appl. 2015, 4, e243. 10.1038/lsa.2015.16. [DOI] [Google Scholar]
- Micillo R.; Panzella L.; Iacomino M.; Prampolini G.; Cacelli I.; Ferretti A.; Crescenzi O.; Koike K.; Napolitano A.; d’Ischia M. Eumelanin Broadband Absorption Develops From Aggregation-Modulated Chromophore Interactions Under Structural and Redox Control. Sci. Rep. 2017, 7, 41532. 10.1038/srep41532. [DOI] [PMC free article] [PubMed] [Google Scholar]
- Liu Y.; Ai K.; Ji X.; Askhatova D.; Du R.; Lu L.; Shi J. Comprehensive Insights into the Multi-Antioxidative Mechanisms of Melanin Nanoparticles and Their Application to Protect Brain From Injury in Ischemic Stroke. J. Am. Chem. Soc. 2017, 139, 856–862. 10.1021/jacs.6b11013. [DOI] [PMC free article] [PubMed] [Google Scholar]
- Li W.; Wang Z.; Xiao M.; Miyoshi T.; Yang X.; Hu Z.; Liu C.; Chuang S. S. C.; Shawkey M. D.; Gianneschi N. C.; Dhinojwala A. Mechanism of UVA Degradation of Synthetic Eumelanin. Biomacromolecules 2019, 20, 4593–4601. 10.1021/acs.biomac.9b01433. [DOI] [PubMed] [Google Scholar]
- Żądło A. C.; Sarna T. Interaction of Iron Ions with Melanin. Acta Biochim. Pol. 2019, 66, 459–462. 10.18388/abp.2019_2889. [DOI] [PubMed] [Google Scholar]
- Li W.; Patil A.; Zhou X.; Wang Z.; Xiao M.; Shawkey M. D.; Gianneschi N. C.; Dhinojwala A. Characterization of Broadband Complex Refractive Index of Synthetic Melanin Coatings and their Changes After Ultraviolet Irradiation. Appl. Phys. Lett. 2020, 117, 203701. 10.1063/5.0024229. [DOI] [Google Scholar]
- Wang Y.; Wang X.; Li T.; Ma P.; Zhang S.; Du M.; Dong W.; Xie Y.; Chen M. Effects of Melanin on Optical Behavior of Polymer: From Natural Pigment to Materials Applications. ACS Appl. Mater. Interfaces 2018, 10, 13100–13106. 10.1021/acsami.8b02658. [DOI] [PubMed] [Google Scholar]
- Vahidzadeh E.; Kalra A. P.; Shankar K. Melanin-Based Electronics: From Proton Conductors to Photovoltaics and Beyond. Biosens. Bioelectron. 2018, 122, 127–139. 10.1016/j.bios.2018.09.026. [DOI] [PubMed] [Google Scholar]
- Echeverri M.; Patil A.; Xiao M.; Li W.; Shawkey M. D.; Dhinojwala A. Developing Noniridescent Structural Color on Flexible Substrates with High Bending Resistance. ACS Appl. Mater. Interfaces 2019, 11, 21159–21165. 10.1021/acsami.9b04560. [DOI] [PubMed] [Google Scholar]
- Shankar S.; Wang L.-F.; Rhim J.-W. Effect of Melanin Nanoparticles on the Mechanical, Water Vapor Barrier, and Antioxidant Properties of Gelatin-Based Films for Food Packaging Application. Food Packag. Shelf Life 2019, 21, 100363. 10.1016/j.fpsl.2019.100363. [DOI] [Google Scholar]
- Liu Y.; Ai K.; Liu J.; Deng M.; He Y.; Lu L. Dopamine-Melanin Colloidal Nanospheres: An Efficient Near-Infrared Photothermal Therapeutic Agent For In Vivo Cancer Therapy. Adv. Mater. 2013, 25, 1353–1359. 10.1002/adma.201204683. [DOI] [PubMed] [Google Scholar]
- Alviano C. S.; Farbiarz S. R.; De Souza W.; Angluster J.; Travassos L. R. Characterization of Fonsecaea pedrosoi Melanin. Microbiology 1991, 137, 837–844. 10.1099/00221287-137-4-837. [DOI] [PubMed] [Google Scholar]
- Ravishankar J. P.; Muruganandam V.; Suryanarayanan T. S. Isolation and Characterization of Melanin from a Marine Fungus. Bot. Mar. 1995, 38, 413–416. 10.1515/botm.1995.38.1-6.413. [DOI] [Google Scholar]
- Selvakumar P.; Rajasekar S.; Periasamy K.; Raaman N. Isolation and Characterization of Melanin Pigment from Pleurotus cystidiosus (telomorph of Antromycopsis macrocarpa). World J. Microbiol. Biotechnol. 2008, 24, 2125–2131. 10.1007/s11274-008-9718-2. [DOI] [Google Scholar]
- Schmaler-Ripcke J.; Sugareva V.; Gebhardt P.; Winkler R.; Kniemeyer O.; Heinekamp T.; Brakhage A. A. Production of Pyomelanin, a Second Type of Melanin, via the Tyrosine Degradation Pathway in Aspergillus fumigatus. Appl. Environ. Microbiol. 2009, 75, 493–503. 10.1128/aem.02077-08. [DOI] [PMC free article] [PubMed] [Google Scholar]
- Liu Y.; Ai K.; Lu L. Polydopamine and its Derivative Materials: Synthesis and Promising Applications in Energy, Environmental, and Biomedical Fields. Chem. Rev. 2014, 114, 5057–5115. 10.1021/cr400407a. [DOI] [PubMed] [Google Scholar]
- Prados-Rosales R.; Toriola S.; Nakouzi A.; Chatterjee S.; Stark R.; Gerfen G.; Tumpowsky P.; Dadachova E.; Casadevall A. Structural Characterization of Melanin Pigments From Commercial Preparations of the Edible Mushroom Auricularia auricula. J. Agr. Food Chem. 2015, 63, 7326–7332. 10.1021/acs.jafc.5b02713. [DOI] [PMC free article] [PubMed] [Google Scholar]
- Ribera J.; Panzarasa G.; Stobbe A.; Osypova A.; Rupper P.; Klose D.; Schwarze F. W. M. R. Scalable Biosynthesis of Melanin by the Basidiomycete Armillaria cepistipes. J. Agric. Food Chem. 2018, 67, 132–139. 10.1021/acs.jafc.8b05071. [DOI] [PubMed] [Google Scholar]
- Wang L.-F.; Rhim J.-W. Isolation and Characterization of Melanin From Black Garlic and Sepia Ink. LWT--Food Sci. Technol. 2019, 99, 17–23. 10.1016/j.lwt.2018.09.033. [DOI] [Google Scholar]
- Hou R.; Liu X.; Xiang K.; Chen L.; Wu X.; Lin W.; Zheng M.; Fu J. Characterization of the Physicochemical Properties and Extraction Optimization of Natural Melanin from Inonotus hispidus Mushroom. Food Chem. 2019, 277, 533–542. 10.1016/j.foodchem.2018.11.002. [DOI] [PubMed] [Google Scholar]
- Zhou X.; McCallum N. C.; Hu Z.; Cao W.; Gnanasekaran K.; Feng Y.; Stoddart J. F.; Wang Z.; Gianneschi N. C. Artificial Allomelanin Nanoparticles. ACS Nano 2019, 13, 10980–10990. 10.1021/acsnano.9b02160. [DOI] [PubMed] [Google Scholar]
- Wang Z.; Tschirhart T.; Schultzhaus Z.; Kelly E. E.; Chen A.; Oh E.; Nag O.; Glaser E. R.; Kim E.; Lloyd P. F. Melanin Produced by the Fast-growing Marine Bacterium Vibrio natriegens Through Heterologous Biosynthesis: Characterization and Application. Appl. Environ. Microbiol. 2020, 86, e02749. 10.1128/AEM.02749-19. [DOI] [PMC free article] [PubMed] [Google Scholar]
- Liu Y.; Kempf V. R.; Brian Nofsinger J.; Weinert E. E.; Rudnicki M.; Wakamatsu K.; Ito S.; Simon J. D. Comparison of the Structural and Physical Properties of Human Hair Eumelanin Following Enzymatic or Acid/Base Extraction. Pigm. Cell Res. 2003, 16, 355–365. 10.1034/j.1600-0749.2003.00059.x. [DOI] [PubMed] [Google Scholar]
- Wang Y.; Aisen P.; Casadevall A. Melanin, Melanin ″Ghosts,″ and Melanin Composition in Cryptococcus neoformans. Infect. Immun. 1996, 64, 2420–2424. 10.1128/iai.64.7.2420-2424.1996. [DOI] [PMC free article] [PubMed] [Google Scholar]
- Pacelli C.; Cassaro A.; Maturilli A.; Timperio A. M.; Gevi F.; Cavalazzi B.; Stefan M.; Ghica D.; Onofri S. Multidisciplinary Characterization of Melanin Pigments From the Black Fungus Cryomyces antarcticus. Appl. Microbiol. Biotechnol. 2020, 104, 6385–6395. 10.1007/s00253-020-10666-0. [DOI] [PubMed] [Google Scholar]
- Ellis M. A.Black Knot of Plums and Cherries. Fact Sheet HYG-3011-94, 2002.
- Fernando W. G. D.; Zhang J. X.; Chen C. Q.; Remphrey W. R.; Schurko A.; Klassen G. R. Molecular and Morphological Characteristics of Apiosporina morbosa, the Causal Agent of Black Knot in Prunus spp. Can. J. Plant Pathol. 2005, 27, 364–375. 10.1080/07060660509507234. [DOI] [Google Scholar]
- Stewart A. Some Observations on the Anatomy and Other Features of the Black Knot. Am. J. Bot. 1914, 1, 112–126. 10.1002/j.1537-2197.1914.tb05383.x. [DOI] [Google Scholar]
- Wainwright S. H.; Lewis F. H. Developmental Morphology of the Black Knot Pathogen on Plum. Phytopathology 1970, 60, 1238–1244. 10.1094/phyto-60-1238. [DOI] [Google Scholar]
- Smith D. H.; Lewis F. H.; Wainwright S. H. Epidemiology of the Black Knot Disease of Plums. Phytopathology 1970, 60, 1441–1444. 10.1094/phyto-60-1441. [DOI] [Google Scholar]
- Huang Z.; Lui H.; Chen X. K.; Alajlan A.; McLean D. I.; Zeng H. Raman Spectroscopy of In Vivo Cutaneous Melanin. J. Biomed. Opt. 2004, 9, 1198–1206. 10.1117/1.1805553. [DOI] [PubMed] [Google Scholar]
- Capozzi V.; Perna G.; Gallone A.; Biagi P. F.; Carmone P.; Fratello A.; Guida G.; Zanna P.; Cicero R. Raman and Optical Spectroscopy of Eumelanin Films. J. Mol. Struct. 2005, 744-747, 717–721. 10.1016/j.molstruc.2004.11.074. [DOI] [Google Scholar]
- Galván I.; Jorge A.; Ito K.; Tabuchi K.; Solano F.; Wakamatsu K. Raman Spectroscopy as a Non-Invasive Technique for the Quantification of Melanins in Feathers and Hairs. Pigm. Cell Melanoma Res. 2013, 26, 917–923. 10.1111/pcmr.12140. [DOI] [PubMed] [Google Scholar]
- Culka A.; Jehlička J.; Ascaso C.; Artieda O.; Casero C. M.; Wierzchos J. Raman Microspectrometric Study of Pigments in Melanized Fungi from the Hyperarid Atacama Desert Gypsum Crust. J. Raman Spectrosc. 2017, 48, 1487–1493. 10.1002/jrs.5137. [DOI] [Google Scholar]
- Camacho E.; Vij R.; Chrissian C.; Prados-Rosales R.; Gil D.; O’Meally R. N.; Cordero R. J. B.; Cole R. N.; McCaffery J. M.; Stark R. E.; Casadevall A. The Structural Unit of Melanin in the Cell Wall of the Fungal Pathogen Cryptococcus neoformans. J. Biol. Chem. 2019, 294, 10471–10489. 10.1074/jbc.ra119.008684. [DOI] [PMC free article] [PubMed] [Google Scholar]
- Ito S. Reexamination of the Structure of Eumelanin. Biochim. Biophys. Acta, Gen. Subj. 1986, 883, 155–161. 10.1016/0304-4165(86)90146-7. [DOI] [PubMed] [Google Scholar]
- Bothma J. P.; de Boor J.; Divakar U.; Schwenn P. E.; Meredith P. Device-quality Electrically Conducting Melanin Thin Films. Adv. Mater. 2008, 20, 3539–3542. 10.1002/adma.200703141. [DOI] [Google Scholar]
- Kittle J. D.; Wang C.; Qian C.; Zhang Y.; Zhang M.; Roman M.; Morris J. R.; Moore R. B.; Esker A. R. Ultrathin Chitin Films for Nanocomposites and Biosensors. Biomacromolecules 2012, 13, 714–718. 10.1021/bm201631r. [DOI] [PubMed] [Google Scholar]
- Cárdenas G.; Cabrera G.; Taboada E.; Miranda S. P. Chitin Characterization by SEM, FTIR, XRD, and 13C Cross Polarization/Mass Angle Spinning NMR. J. Appl. Polym. 2004, 93, 1876–1885. 10.1002/app.20647. [DOI] [Google Scholar]
- Chatterjee S.; Prados-Rosales R.; Itin B.; Casadevall A.; Stark R. E. Solid-State NMR Reveals the Carbon-Based Molecular Architecture of Cryptococcus neoformans Fungal Eumelanins in the Cell Wall. J. Biol. Chem. 2015, 290, 13779–13790. 10.1074/jbc.m114.618389. [DOI] [PMC free article] [PubMed] [Google Scholar]
- Forfang K.; Zimmermann B.; Kosa G.; Kohler A.; Shapaval V. FTIR Spectroscopy for Evaluation and Monitoring of Lipid Extraction Efficiency for Oleaginous Fungi. PLoS One 2017, 12, e0170611. 10.1371/journal.pone.0170611. [DOI] [PMC free article] [PubMed] [Google Scholar]
- Manini P.; Lucci V.; Lino V.; Sartini S.; Rossella F.; Falco G.; Chiappe C.; d’Ischia M. Synthetic Mycomelanin Thin Films as Emergent Bio-inspired Interfaces Controlling the Fate of Embryonic Stem Cells. J. Mater. Chem. B 2020, 8, 4412–4418. 10.1039/d0tb00623h. [DOI] [PubMed] [Google Scholar]
- Raman N. M.; Ramasamy S. Genetic Validation and Spectroscopic Detailing of DHN-Melanin Extracted From an Environmental Fungus. Biochem. Biophys. Rep. 2017, 12, 98–107. 10.1016/j.bbrep.2017.08.008. [DOI] [PMC free article] [PubMed] [Google Scholar]
- Fukamizo T.; Kramer K. J.; Mueller D. D.; Schaefer J.; Garbow J.; Jacob G. S. Analysis of Chitin Structure by Nuclear Magnetic Resonance Spectroscopy and Chitinolytic Enzyme Digestion. Arch. Biochem. Biophys. 1986, 249, 15–26. 10.1016/0003-9861(86)90555-2. [DOI] [PubMed] [Google Scholar]
- Tian S.; Garcia-Rivera J.; Yan B.; Casadevall A.; Stark R. E. Unlocking the Molecular Structure of Fungal Melanin Using 13C Biosynthetic Labeling and Solid-State NMR. Biochemistry 2003, 42, 8105–8109. 10.1021/bi0341859. [DOI] [PubMed] [Google Scholar]
- Chrissian C.; Camacho E.; Fu M. S.; Prados-Rosales R.; Chatterjee S.; Cordero R. J. B.; Lodge J. K.; Casadevall A.; Stark R. E. Melanin Deposition in Two Cryptococcus Species Depends on Cell-Wall Composition and Flexibility. J. Biol. Chem. 2020, 295, 1815–1828. 10.1074/jbc.ra119.011949. [DOI] [PMC free article] [PubMed] [Google Scholar]
- Knicker H.; Almendros G.; González-Vila F. J.; Lüdemann H.-D.; Martin F. 13C and 15N NMR Analysis of Some Fungal Melanins in Comparison with Soil Organic Matter. Org. Geochem. 1995, 23, 1023–1028. 10.1016/0146-6380(95)00094-1. [DOI] [Google Scholar]
- Centeno S. A.; Shamir J. Surface Enhanced Raman Scattering (SERS) and FTIR Characterization of the Sepia Melanin Pigment Used in Works of Art. J. Mol. Struct. 2008, 873, 149–159. 10.1016/j.molstruc.2007.03.026. [DOI] [Google Scholar]
Associated Data
This section collects any data citations, data availability statements, or supplementary materials included in this article.


