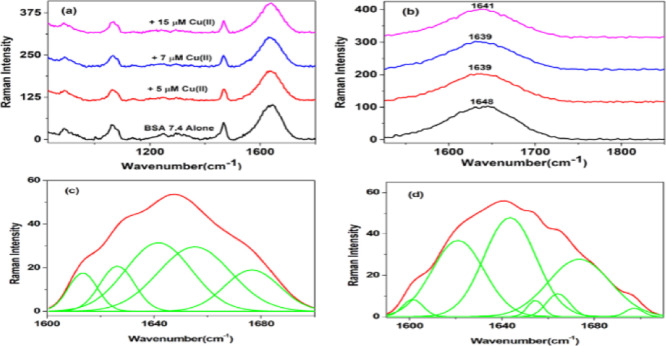
Figure 7.
Raman spectra of BSA and the BSA–Cu(II) complex at physiological pH. (a) Raman spectra of BSA alone and in the presence of different concentrations of Cu(II) (800–1800 cm–1). (b) Amide I (1600–1700 cm–1) region. (c,d) Amide I region of BSA alone and with the addition of 15 μM Cu(II) deconvoluted displaying an increase in antiparallel β-sheet conformation.

