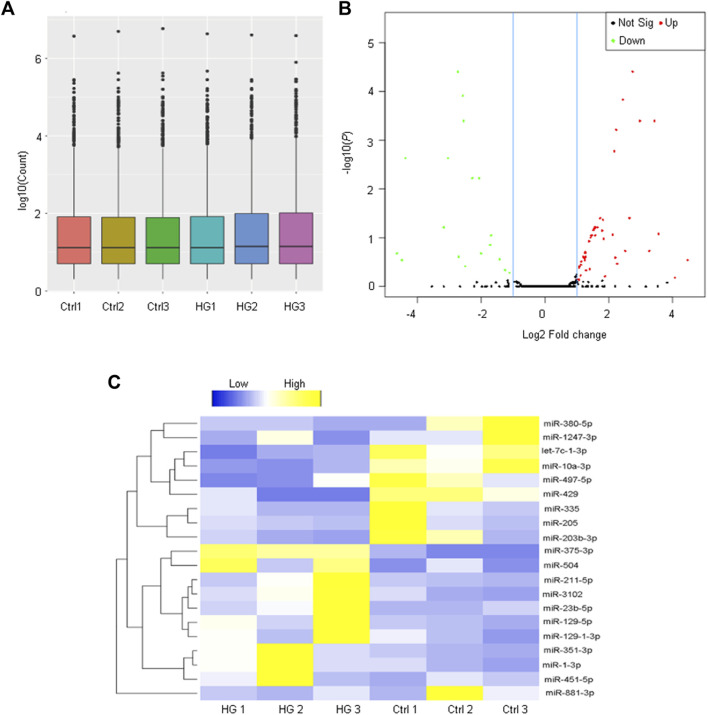
FIGURE 2.
Analysis of miRNA profiling of EPCs derived from the bone marrow. (A) The box plot is depicted to show the distribution of miRNA expression pattern across different samples. The boxes with a central line and two tails represent the median of the data and the upper and lower quartiles, respectively. (B) The volcano plot shows the differentially expressed miRNAs between EPCs derived from the bone marrow with or without high-glucose treatment. (C) Heatmaps generated from hierarchical cluster analysis display 20 differentially expressed miRNAs between EPCs derived from the bone marrow with or without high-glucose treatment. Yellow color and blue color indicate the up-regulated and down-regulated miRNAs, respectively.

