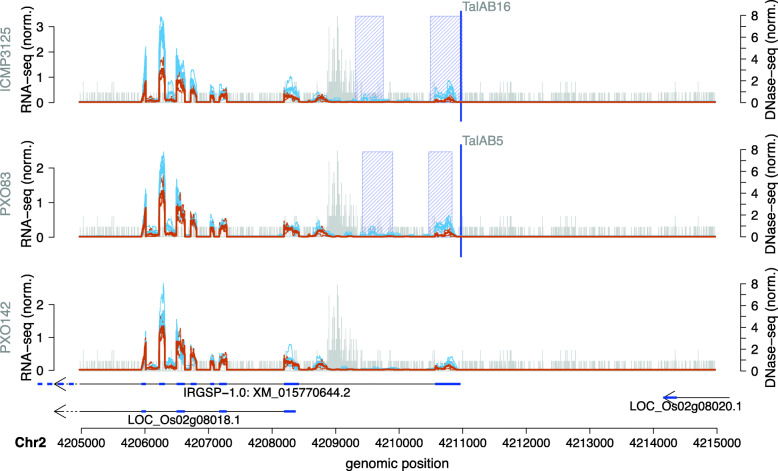
Fig. 4.
Genome-wide predictions of TalAB in Oryza sativa Nipponbare profile for 3 Xoo strains in the area of the TalAB target box. RNA-seq coverage of 3 replicates after inoculation (thin blue lines) are compared with the RNA-seq coverage of 3 replicates of mock control (thin brown lines). In addition, we plot the average coverage of individual replicates after inoculation as a thick blue line and the average coverage of individual replicates of mock control as a thick brown line. The blue shaded boxes mark the differentially expressed regions. The arrows under the profiles reflect the MSU7 annotation within the genomic region. The genomic position of the TALE target box is marked by a vertical blue line. Vertical grey bars indicate the number and 5’-position of reads in the DNase data

