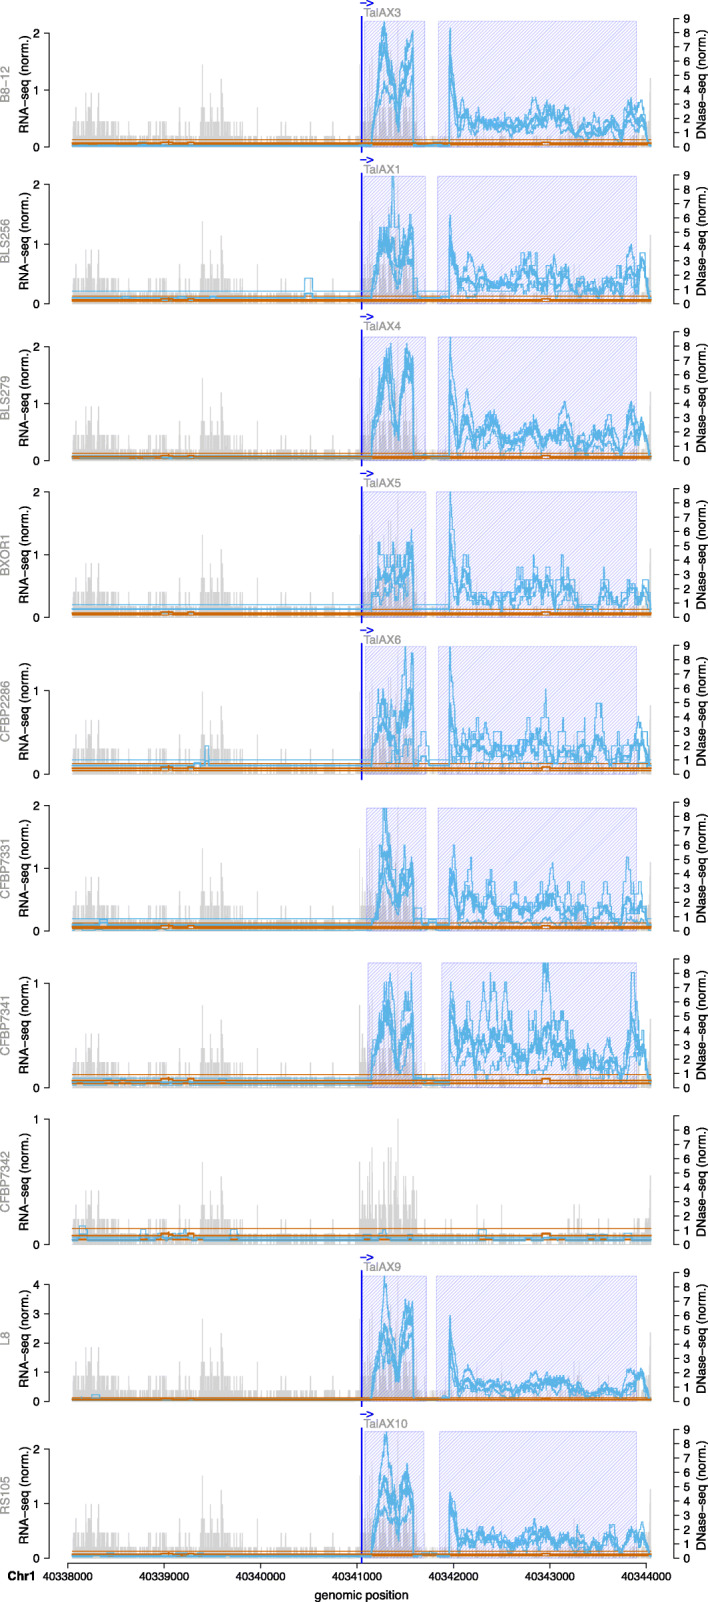
Fig. 5.

Genome-wide predictions of TalAX in Oryza sativa Nipponbare profile for 10 Xoc strains in the area of the TalAX target box. RNA-seq coverage of 3 replicates after inoculation (thin blue lines) are compared with the RNA-seq coverage of 3 replicates of mock control (thin brown lines). In addition, we plot the average coverage of individual replicates after inoculation as a thick blue line and the average coverage of individual replicates of mock control as a thick brown line. The blue shaded boxes mark the differentially expressed regions. The genomic position of the TALE target box is marked by a vertical blue line. Vertical grey bars indicate the number and 5’-position of reads in the DNase data
