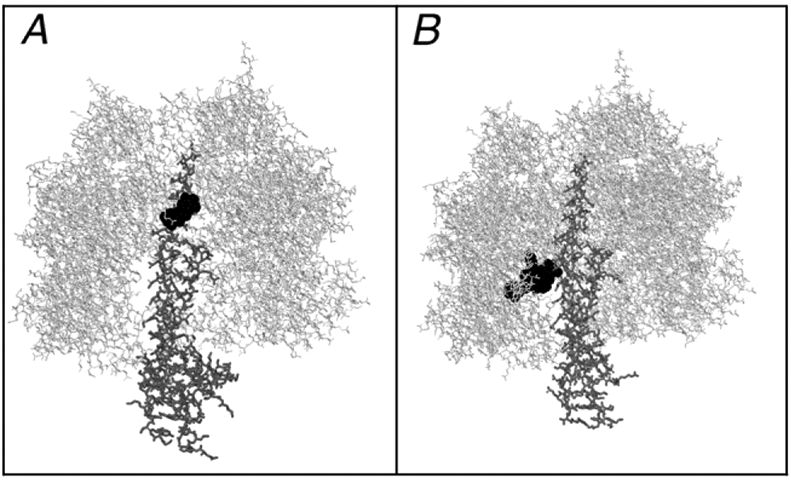
Figure 3.

Comparison of Actual and Predicted Inhibitor Binding Sites in Bovine F1-ATPase. F1 is shown in gray wireframe, the gamma subunit is in thick wireframe, and the inhibitors are shown in black spacefilling. (A) The model shown is from Protein Data Bank file 2jj2. (B) The results from a docking study of TF3 and the F1-ATPase from Protein Data Bank file 1efr are shown. In both cases the inhibitors are bound to the gamma subunit, but the TF3 is docked much lower, and below the nucleotide binding sites. The TF3 site in panel B is accessible from the bottom of the structure, as shown, rather than from the top, as in panel A.
