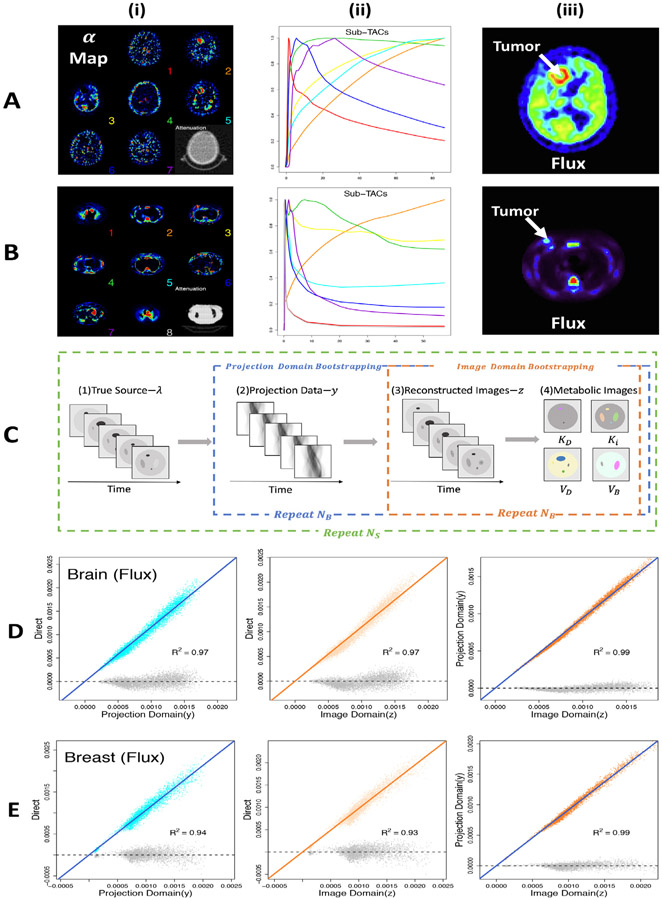
Fig. 3.
Source distribution, λxt = ∑k=1αk(x)μk(t), for the 2-D simulation experiments. Rows corresponds to the FDG-Brain data (A) and FLT-Breast data (B). αk(x) patterns and attenuation in (i), time-courses for each component, μk(t) (normalized), are in (ii). Flux parameters are in (iii). (C) Dynamic image-domain source leads to a corresponding projection domain array. Simulated counts are reconstructed and computed metabolic images. Each replicate of the simulation has both non-parametric (projection-domain) and model-based (image-domain) bootstrapping. Voxel estimates of average standard deviations of flux are shown on rows D and E. The true values are estimated by direct replication, these values are compared to image and projection domain bootstraps for a single replicate.

