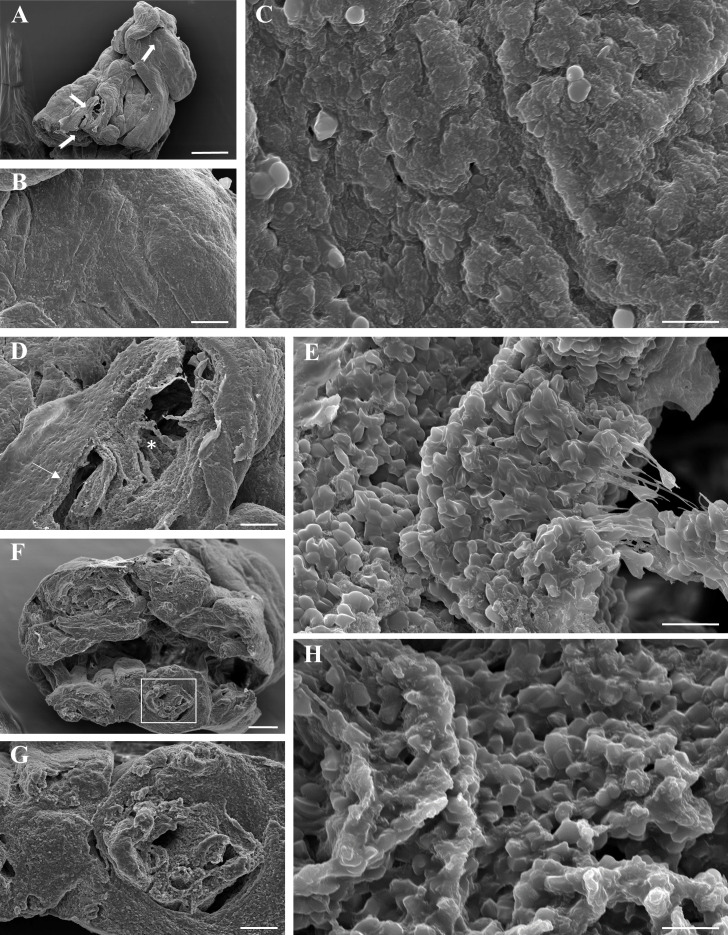
Figure 4.
Representative scanning electron microscopy (SEM) images of an acute ischaemic stroke thrombus. (A) Arrows correspond to the locations analysed by SEM. The surface of the clot shows multiple folds and ridges. (B) Distinct thrombotic components are not discernible on the surface that appears smooth. (C) High magnification of the surface suggestive of dense integration of components and advanced organisation. Only a few red blood cells are evident. (D) The rift on the surface shows the presence of a dense outer shell (arrow) and a different structure of the interior of the clot (asterisk). (E) Magnified area of the interior of the clot displays numerous individual polyhedrocytes and some distinct fibrin strands suggesting an immature structure. (F) The cross-section exposes the thrombus core which is detailed in (G). (H) Identifiable thrombus components indicate a limited maturity and incomplete integration. Scale bar=10 µm (C, E, H), 100 µm (B, D, G), 200 µm (F) and 500 µm (A).

