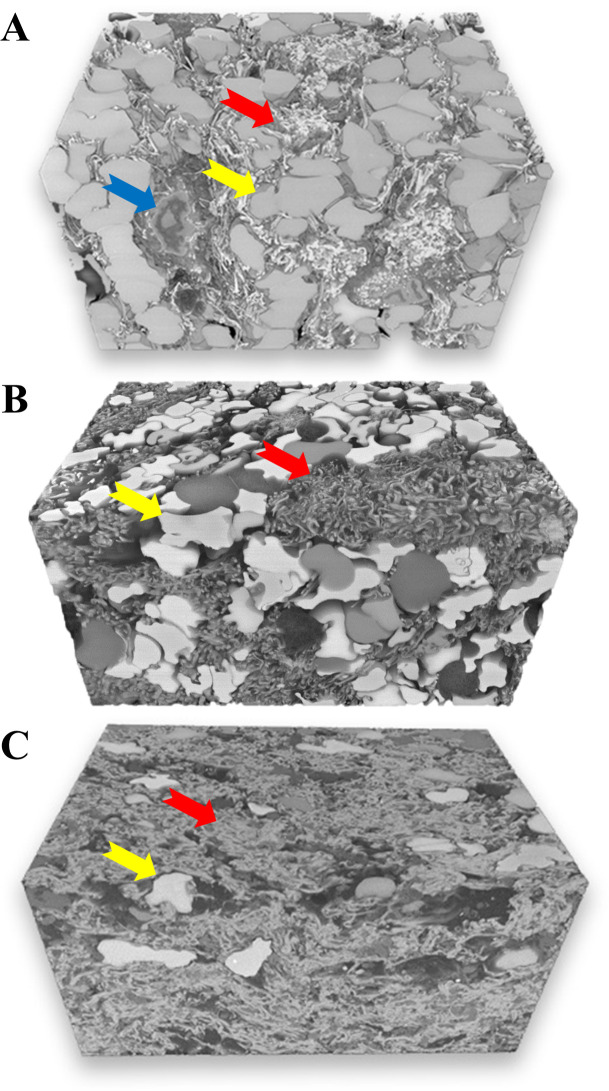
Figure 5.
Three-dimensional scanning electron microscopy analysis in three representative cases. Volume renderings assembled from serial block-face imaging highlight detailed ultrastructural organisation and characteristics of individual components for each clot (red blood cells (RBC)=yellow arrows, fibrin=red arrows, white blood cells=blue arrow). (A) Clot area with tightly packed RBC as polyhedrocytes intermixed with a limited volume of thin fibrin fibres. (B) Clot area with mixed composition consisting of both packed polyhedrocytes and dense network of thick fibrin fibres. (C) Fibrin-rich area containing dense fibrin masses with sparse polyhedrocytes.

