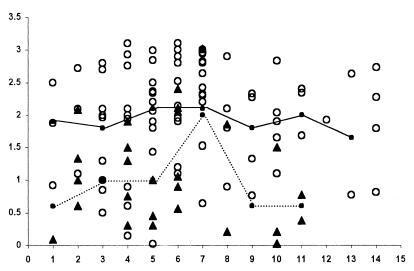
FIG. 2.
IgG responses in surviving (○) and nonsurviving (▴) patients with acute infections of AND virus. Time (in days after onset of symptoms) is shown on the x axis, and optical density (1:400) is shown on the y axis. The data for five children less than 13 years old who died and six children less than 13 years who survived are included here. The solid line represents the mean IgG values for survivors; the dotted line represents the mean IgG values for nonsurvivors (each point [●] is the average IgG value for a consecutive 2-day interval).

