Fig. 4.
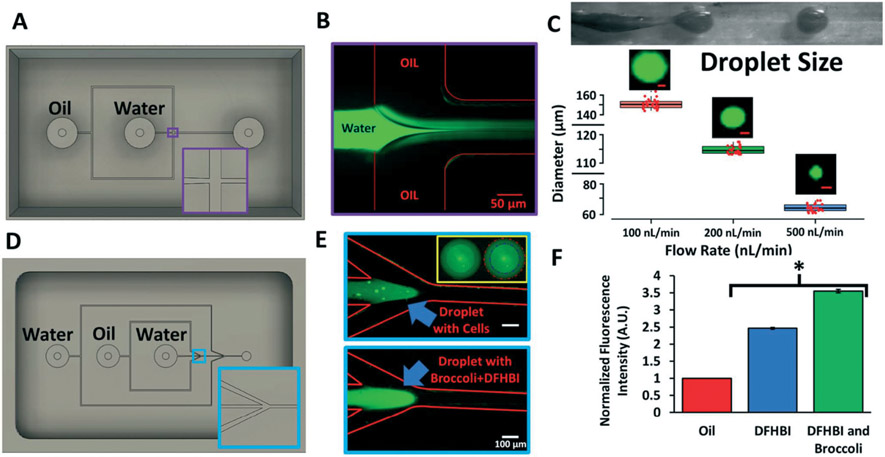
PDMS droplet generators cast from 3D printed molds. A) CAD design for the 3D printed single-wall emulsion droplet generator. Inset highlights the geometry of the flow-focusing T-junction. B) Representative image of the fluorescein-filled aqueous phase jetting into the oil phase to create the emulsion. C) Brightfield image of the jetting regime and subsequent droplet generation. At 3 different flow rates, droplets diameters were quantified using ImageJ. Data are presented as mean and standard deviation from 3 independent replicates (~100 droplets were counted per replicate, and randomly selected droplets are shown as individual red data points to highlight reproducibility). Representative fluorescein-filled droplets are shown for each flow rate (scale bars, 50 μm). D) CAD design for the 3D printed double-wall emulsion droplet generator. Inset highlights the angled flow-focusing junction. E) Representative images of the jetting regime where the aqueous phase contains calcein-labeled Jurkat cells or the broccoli RNA aptamer with DFHBI. The inset highlights the double-wall shell containing labeled Jurkat cells (blue line, inner wall; red line, outer wall). F) Quantification of fluorescence of double-wall droplets containing DFBH versus DFHB and the broccoli RNA aptamer. Fluorescence was normalized to the oil phase. Data are presented as mean and standard deviation from 3 independent replicates. A student's unpaired t-test was used to compare DFHBI with and without broccoli (*p < 0.0001).

