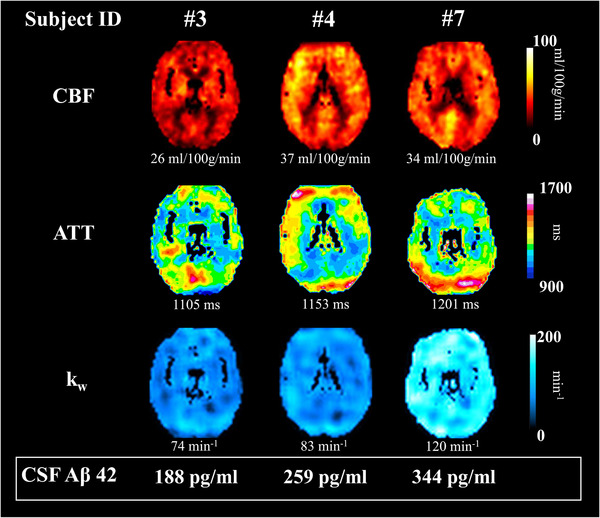
FIGURE 4.

Schematic representation of findings. Maps of cerebral blood flow (CBF), arterial transit time (ATT), and blood‐brain barrier water exchange (kw) are presented from three representative participants showing the trend of increasing kw values being associated with increasing cerebrospinal fluid (CSF) amyloid beta (Aβ)42 concentration (from left to right). Participants’ whole brain CBF, ATT, and kw values are presented below their maps. Participants’ CSF Aβ42 concentration values are presented at the bottom of the figure, within the white box
