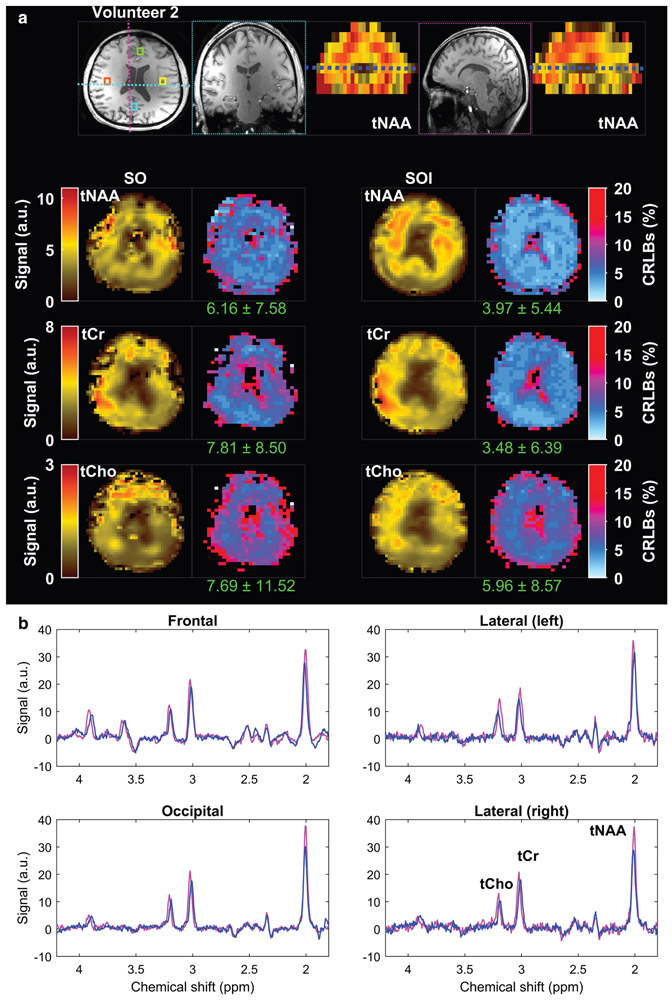
FIGURE 7:
Metabolic maps obtained with spiral-out (SO) and spiral-out-in (SOI) trajectories in the second volunteer. (a) The axial slice is selected from the dashed-dark blue line illustrated on the coronal and sagittal tNAA maps on the top. The coronal and sagittal views of the T1-weighted image were extracted from the regions determined on the axial view, illustrated by the cyan and the magenta dashed lines, respectively. (b) Total NAA (tNAA), total choline (tCho), total creatine (tCr), and corresponding Cramer–Rao lower bound error (CRLB) maps are shown for both acquisition methods. The values provided under each CRLB map indicate the mean and standard deviation calculated over the whole-brain slab. Examples of spectra from frontal (green box), lateral-left (yellow box), lateral-right (orange box), and occipital (cyan box) regions are shown overlaid on the T1-weighted image at the top for SO (blue) and SOI (magenta). Positions of metabolic maps and voxels are indicated on the anatomical MEMPRAGE shown in (a).

