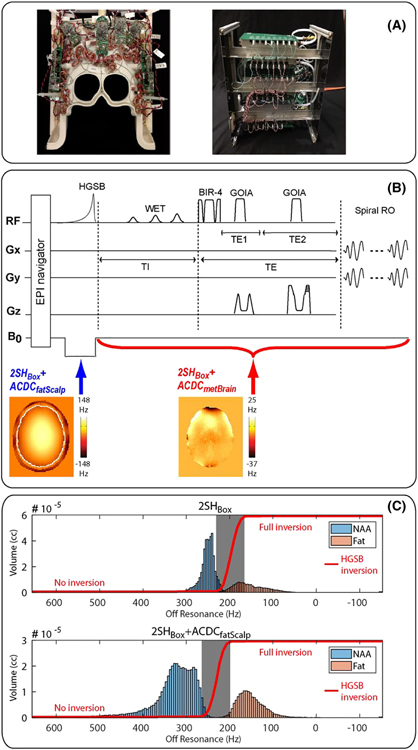
FIGURE 1.
(A) 32-channel AC/DC coil (left) and shim control boards (right); (B) Pulse sequence diagram showing the dynamic shim update. Arrows indicate the times at which the different dynamic shims are applied; (C) Histogram of fat and N-acetyl aspartate (NAA) frequency distribution in the scalp layer and brain compartment, respectively, for standard 2SHBox shimming (top) and fat suppression shimming (bottom). The hypergeometric single band (HGSB) inversion profile is shown by the red line and the transition band by the gray boxes. An offset of 0 Hz corresponds to the frequency of tetramethylsilane

