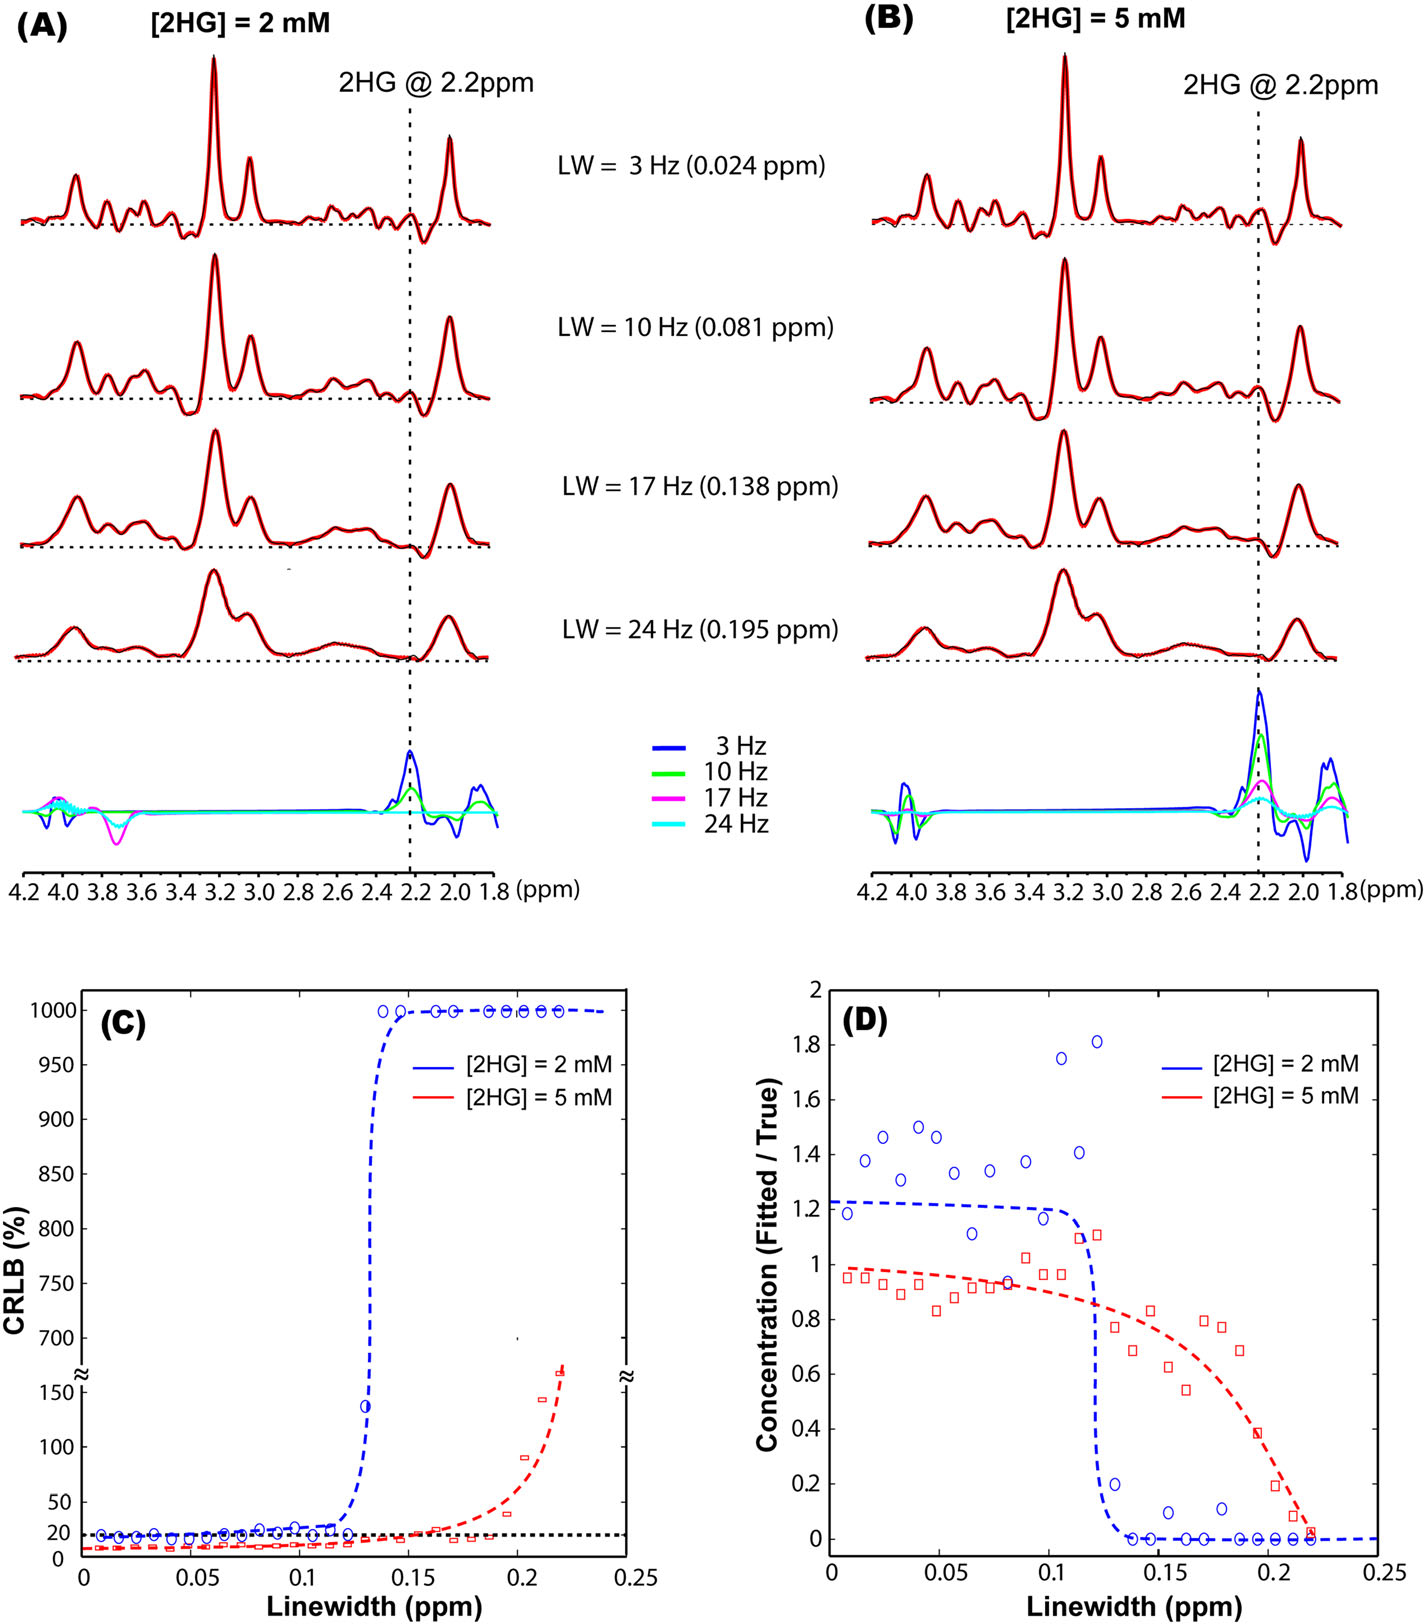
FIGURE 2.

Effect of increasing the linewidth on fitting simulated brain tumor spectra that contained 14 brain metabolites and D-2-hydroxyglutarate (2HG): (A) Tumor spectra containing 2 mM 2HG, and (B) Tumor spectra containing 5 mM 2HG. The effect of increasing linewidths on the precision and accuracy of 2HG quantification in simulated spectra: (C) Cramér–Rao lower bounds (CRLB) values are indicative of precision, and (D) the ratio between the true and fitted concentration is indicative of accuracy. Spectra were simulated in GAMMA for the ASE sequence assuming TE = 97 ms (TE1/TE2 = 32/65 ms) and a 3-T B0 field. LCModel fitting (A, B) is shown in red overlaid on the simulated spectra shown in black in the upper four rows, and below, the fitted 2HG contribution in each spectrum is shown for the four linewidths. Trend lines (dashed) are shown in (C, D), and the 20% CRLB threshold for goodness of fit is indicated by the dashed line in (C), while the ground truth value is shown by the dashed line drawn at 1 in (D)
