
FIGURE 3.
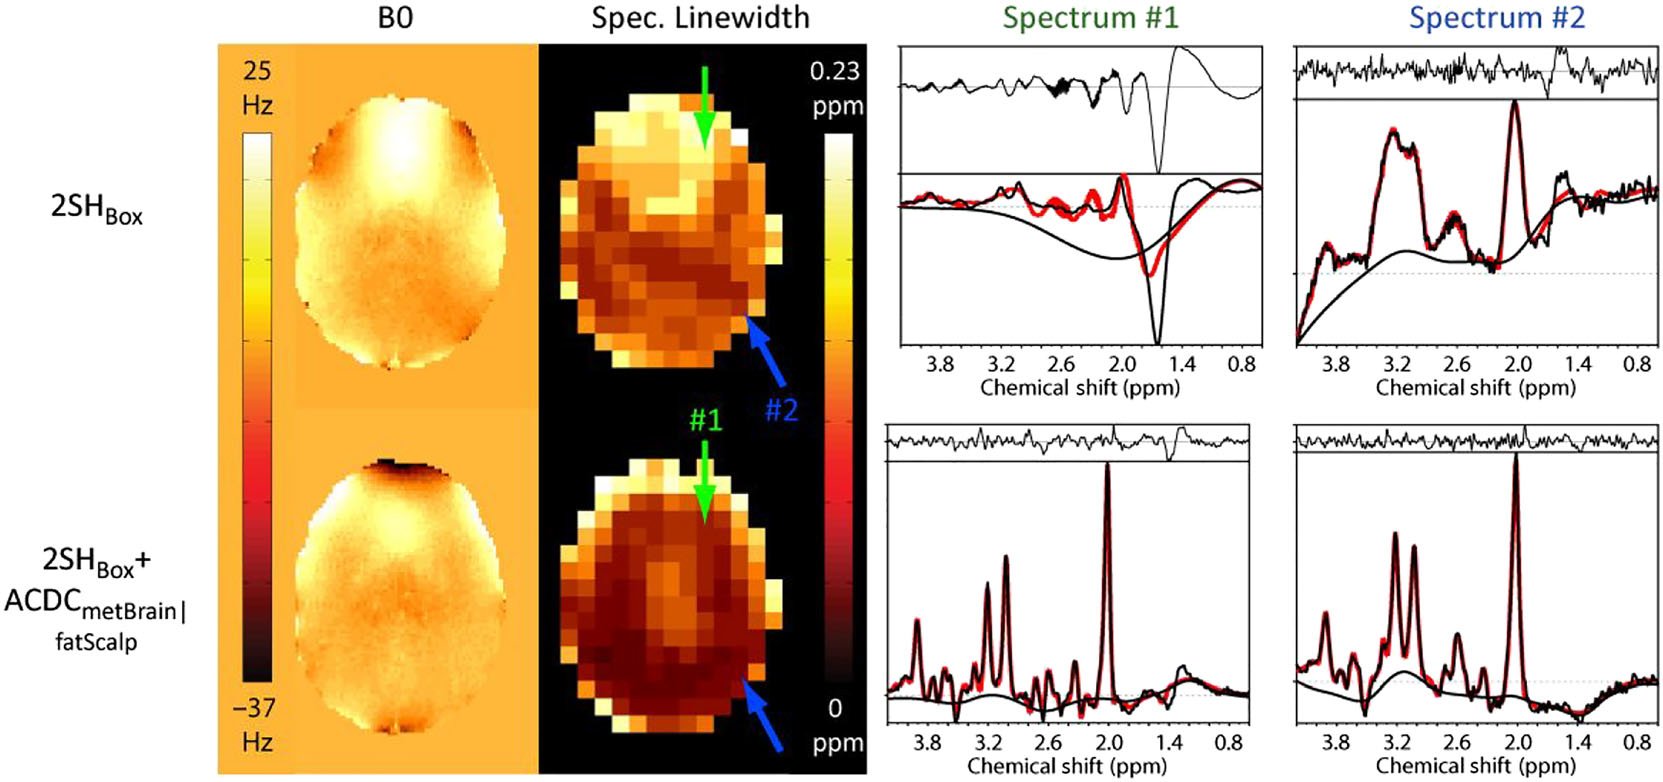
Measured B0-maps of patient 2 acquired with the 2SHBox and with the 2SHBox + ACDCmetBrain (first column). As a result of the higher B0-homogeneity, the average spectral linewidth was decreased with the 2SHBox + ACDCmetBrain|fatScalp (second column). Arrows indicate the position of the sample spectra (right two columns). The 2SHBox + ACDCmetBrain|fatScalp spectrum #1 shows significantly narrower linewidth, while spectrum #2 displays narrower linewidth and a flatter baseline due to the improved lipid and water suppression in the dynamic 2SHBox + ACDCmetBrain|fatScalp condition. Fat contamination is especially visible in spectrum #1 with 2SHBox. LCModel fitting shown in red is overlaid on the measured spectra (black)