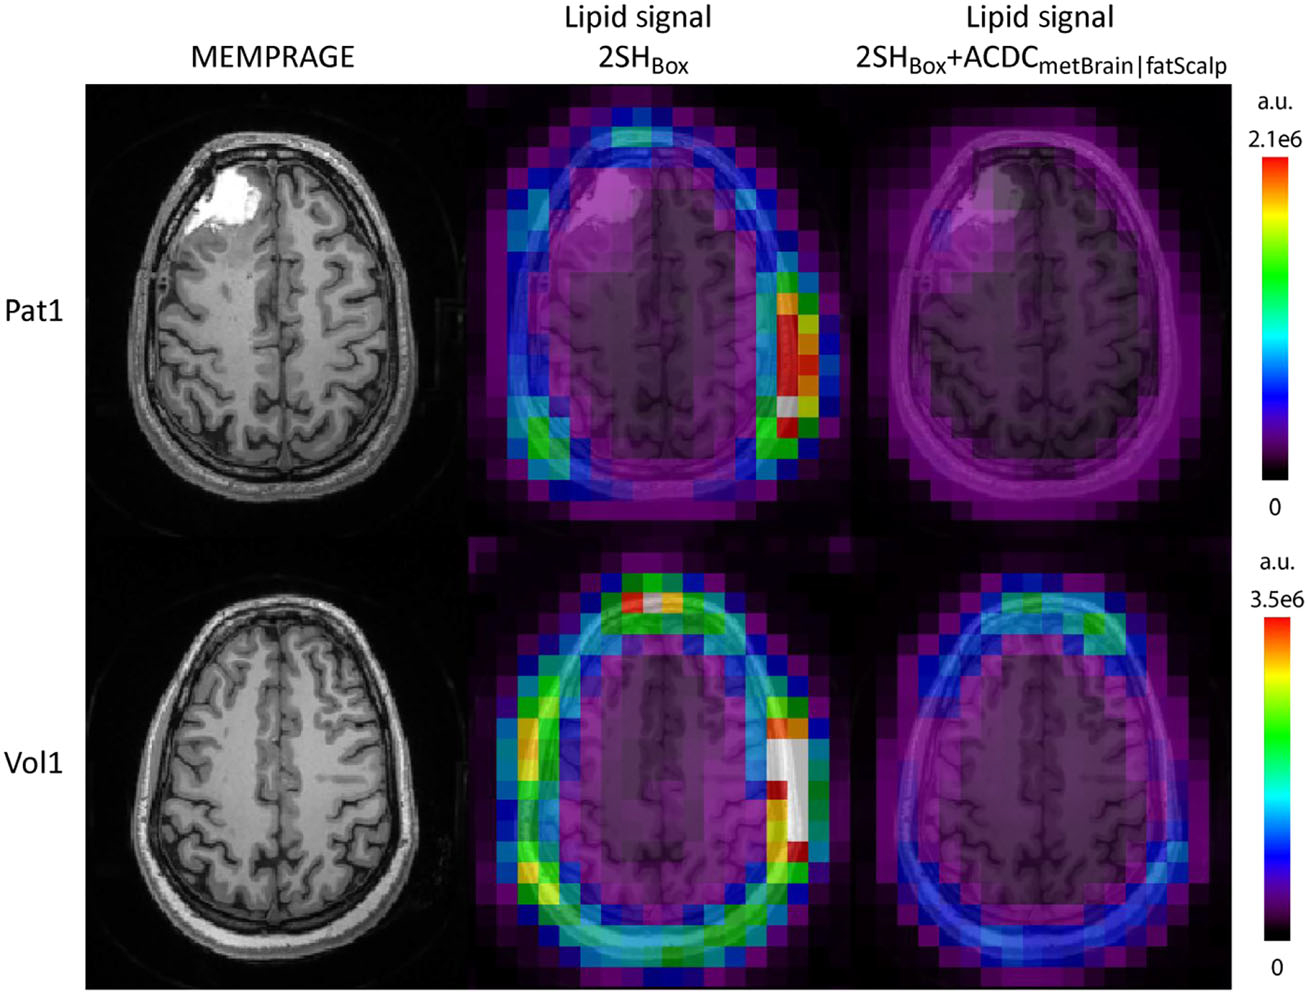
FIGURE 4.

Lipid maps for the standard 2SHBox shim and the 2SHBox + ACDCmetBrain|fatScalp for patient 1 and volunteer 1 together with the MEMPRAGE images. A decrease in the lipid content is clearly visible for both subjects for the 2SHBox + ACDCmetBrain|fatScalp in comparison with the 2SH shim. The lipids in 2SHBox + ACDCmetBrain|fatScalp were decreased to 0.43 ± 0.49 (mean ± std) of the 2SHBox values for those two subjects. Lipid maps are given in arbitrary units
