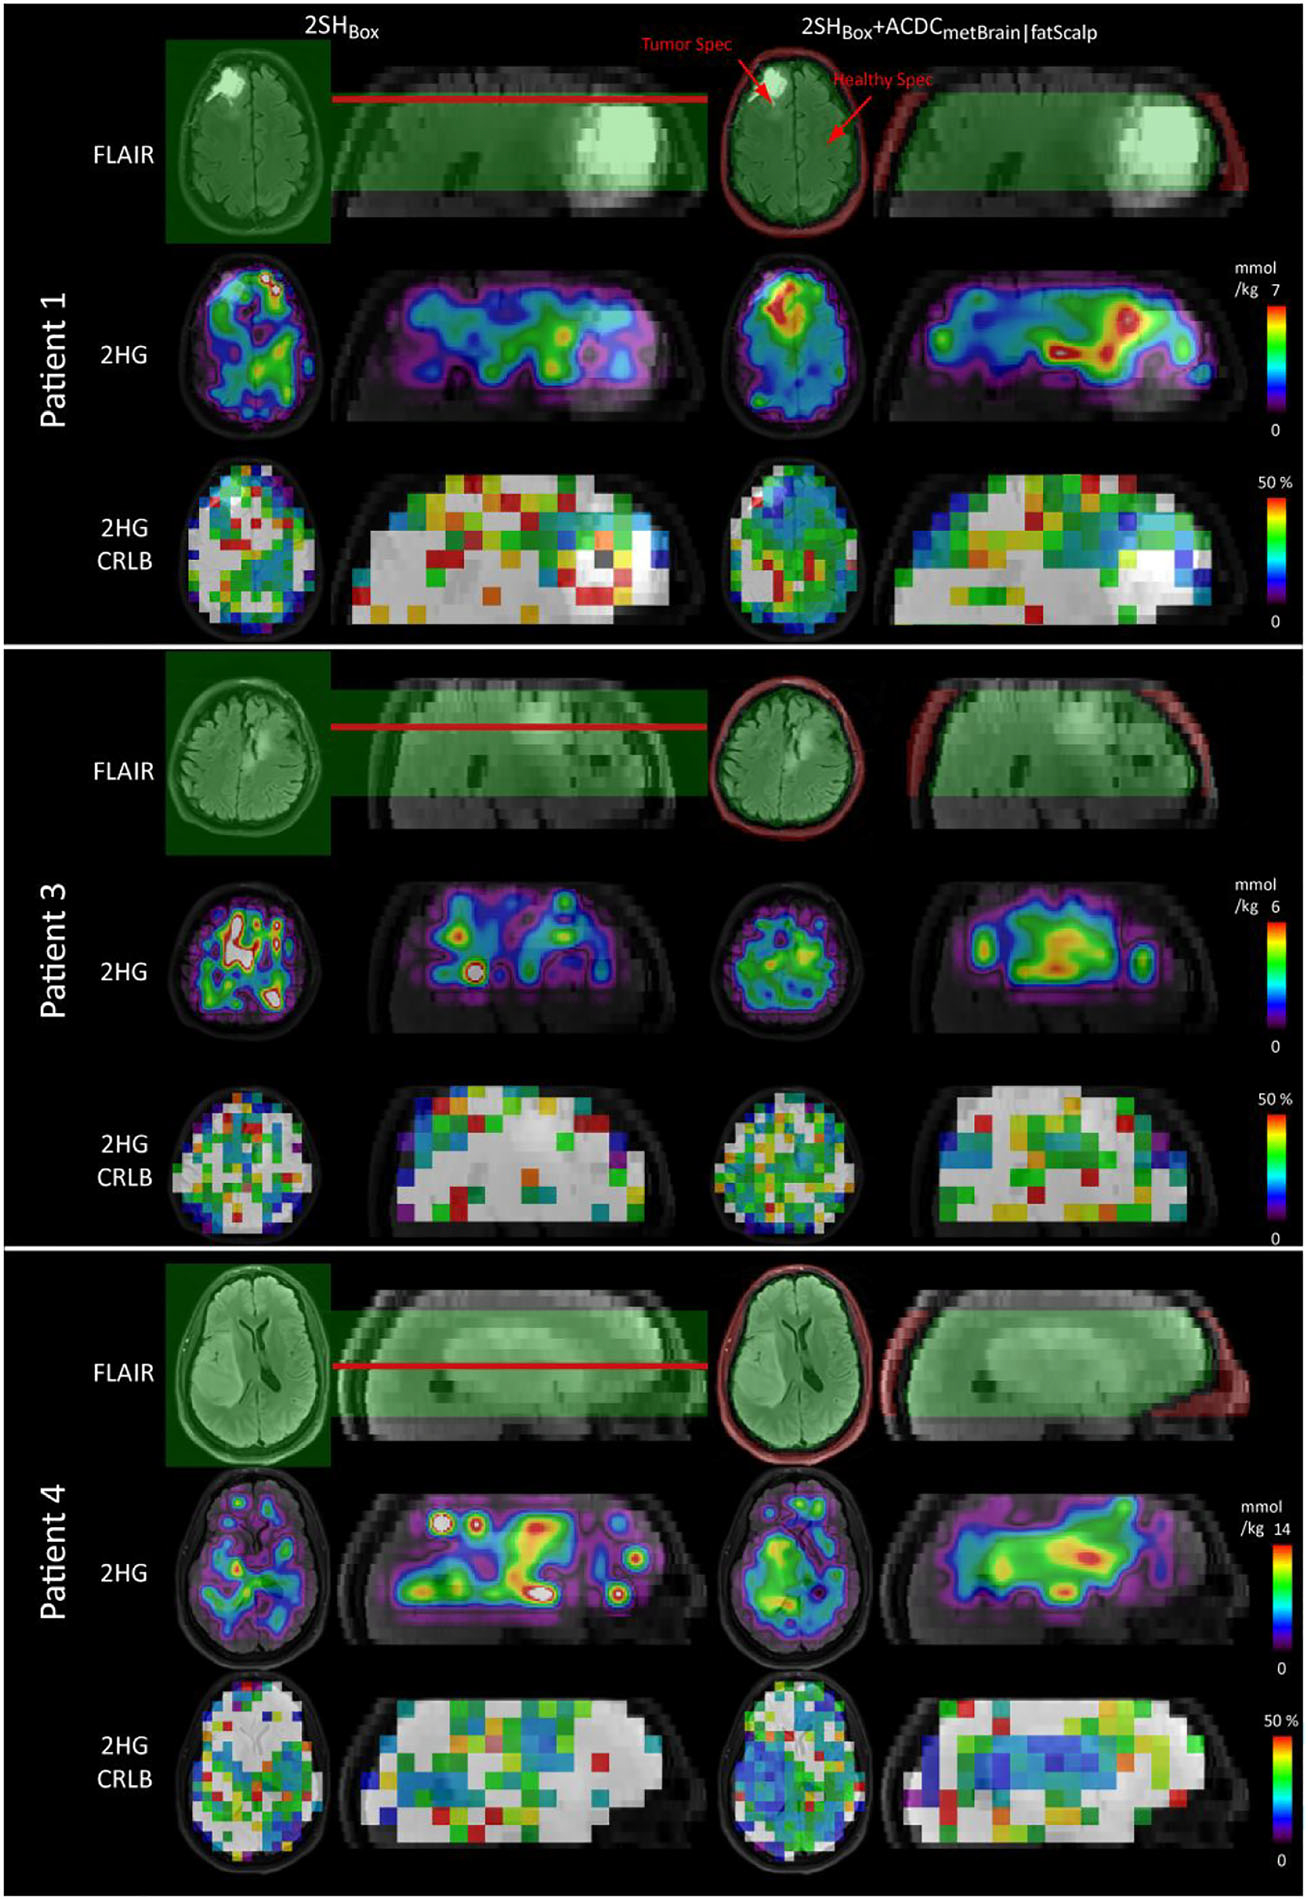
FIGURE 5.

D-2-hydroxyglutarate (2HG) maps obtained by 2SHBox shim and the 2SHBox + ACDCmetBrain|fatScalp in patients 1, 3, and 4. Absolute 2HG concentrations were calculated by normalizing to the mean total creatine (tCr) signal. Cramér–Rao lower bounds (CRLB) maps are shown with 50% maximum threshold. Low CRLB in the tumor are obtained in particular with the 2SHBox + ACDCmetBrain|fatScalp. Red arrows indicate the spectra location shown in Figure S2. The shim volumes are shown in green (2SHBox and ACDCmetBrain) and red (ACDCfatScalp) overlaid on the FLAIR. The red lines indicate the positions of the shown transverse slices. 2HG maps with the native resolution are shown in supporting information file S9 together with the interpolated resolution
