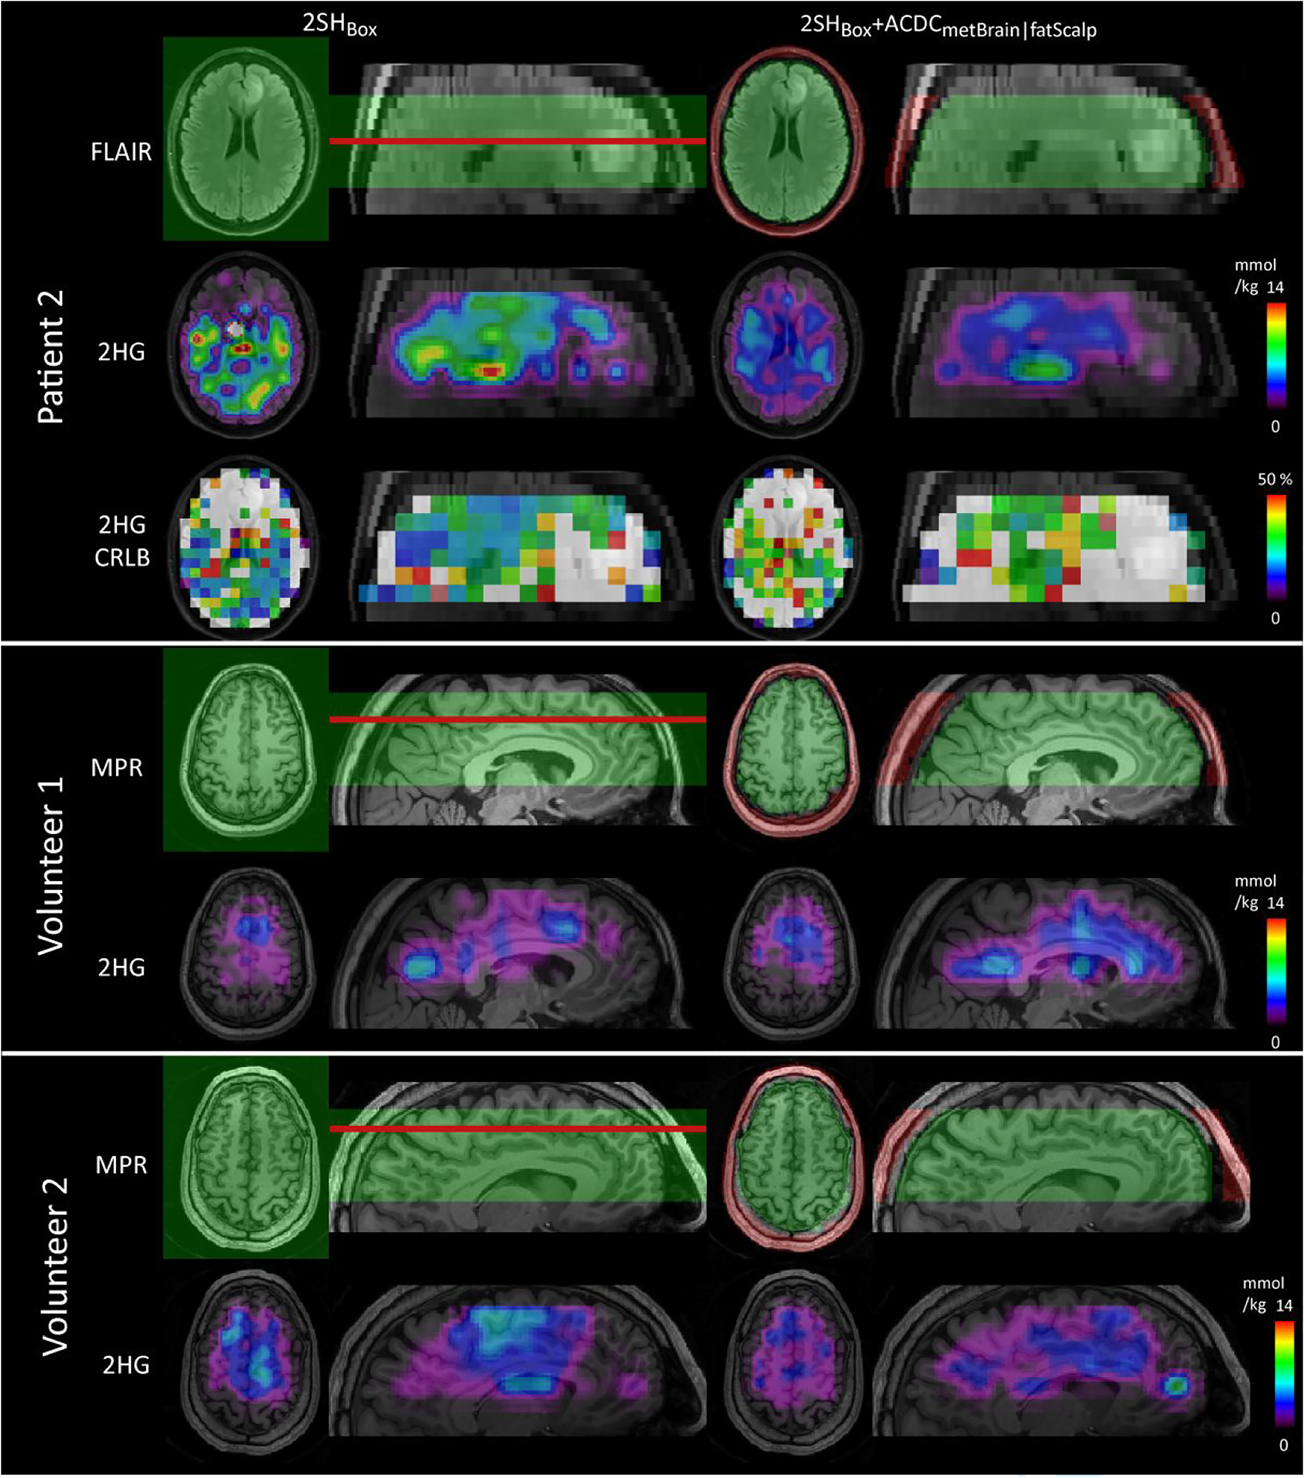
FIGURE 6.

D-2-hydroxyglutarate (2HG) maps obtained by 2SHBox shim and the 2SHBox + ACDCmetBrain|fatScalp in patient 2 and volunteers 1 and 2. With standard 2SHBox shimming, high 2HG foci can be seen in random locations throughout healthy brain and far from the tumor in the patient. The 2HG maps show fewer remote foci outside the tumors with the 2SHBox + ACDCmetBrain|fatScalp shim. Patient 2 had a low-grade small tumor with a very low density of mutant IDH1-R132H cells and its 2HG levels are expected to be very close to the normal background. The shim volumes are shown in green (2SHBox and ACDCmetBrain) and red (ACDCfatScalp) overlaid on the FLAIR or MEMPRAGE. The red lines indicate the positions of the shown transverse slices. 2HG maps with the native resolution are shown in supporting information file S9 together with the interpolated resolution
