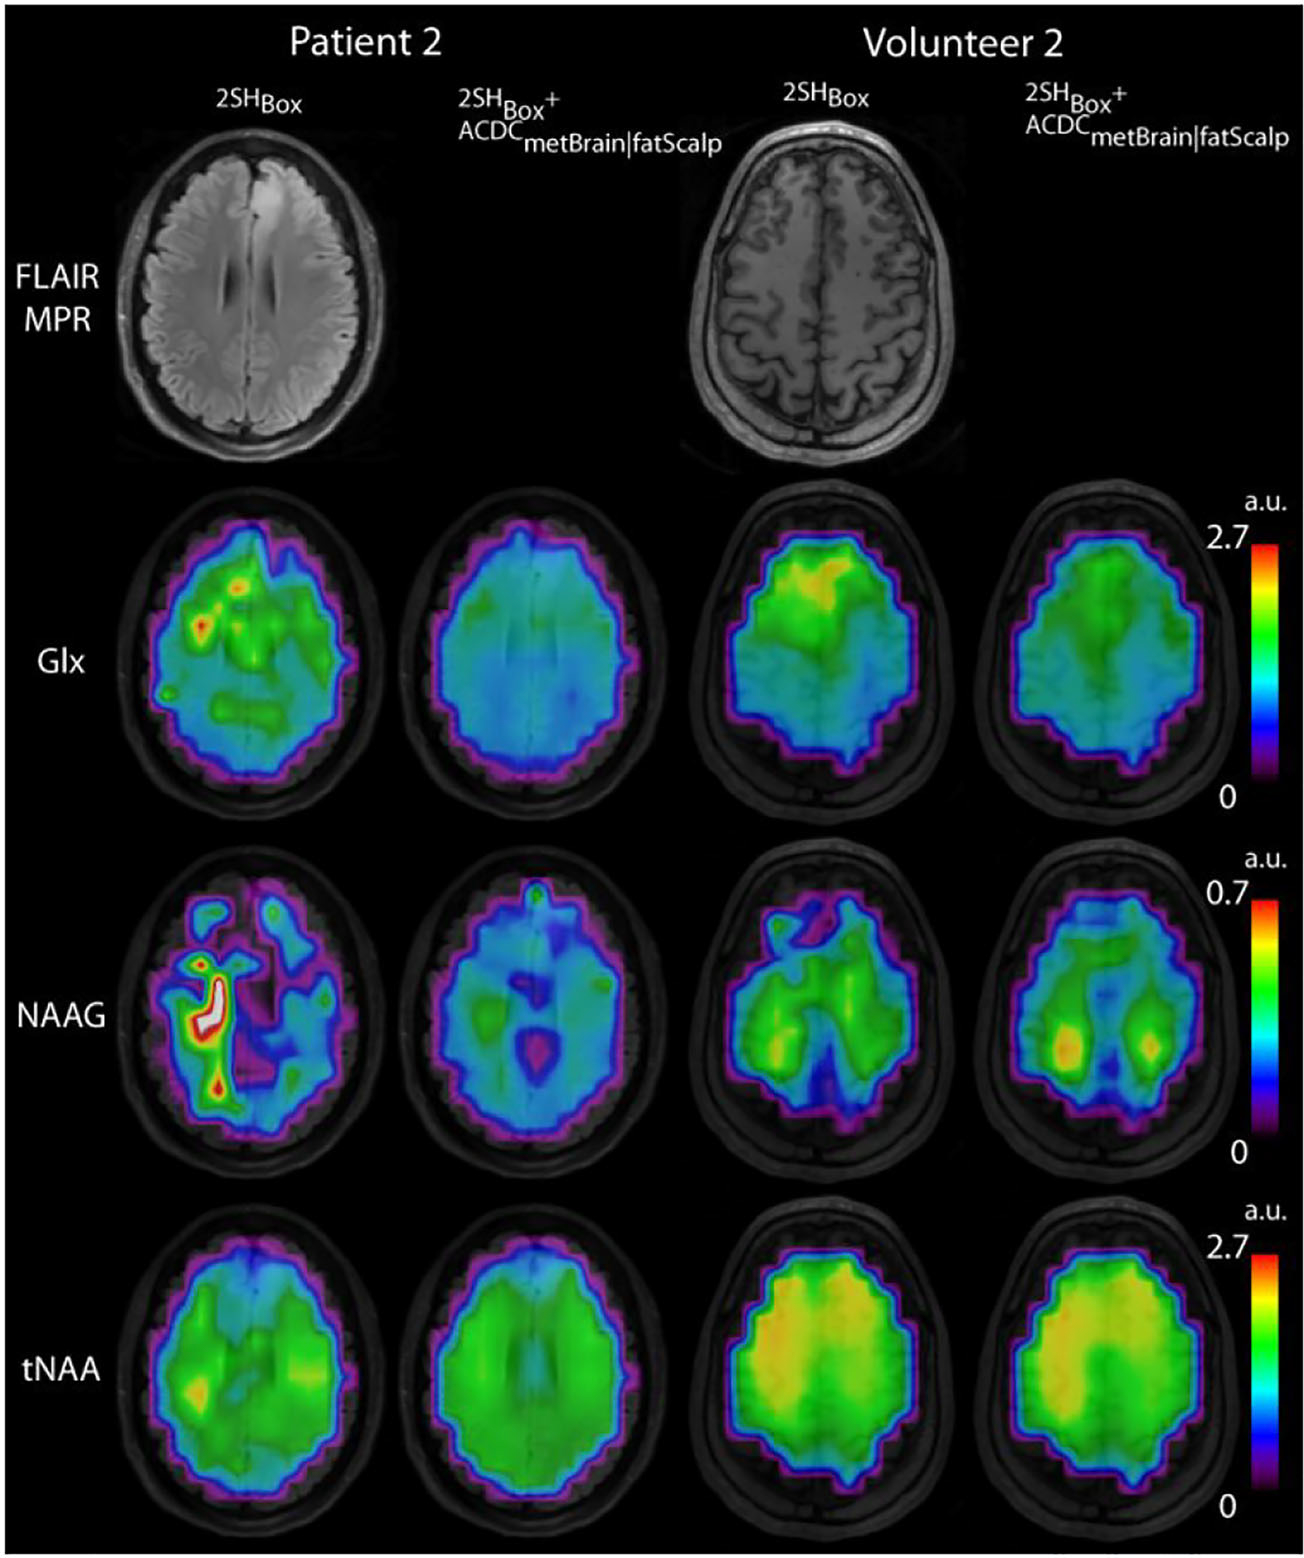
FIGURE 7.

Glx, NAAG, and tNAA maps for volunteer 2 and patient 2 overlaid on MEMPRAGE images. This figure shows a clear improvement in metabolic maps other than 2HG when using the 2SHBox + ACDCmetBrain|fatScalp shim compared with the 2SHBox shim only. In patient 2 there is more spatial variability in 2SHBox metabolic maps with foci of high and low intensity in random locations, while 2SHBox + ACDCmetBrain|fatScalp metabolic maps correspond better to brain anatomy and tumor location. Volunteer 2 provides an example of where the improvement by the 2SHBox + ACDCmetBrain|fatScalp shim is smaller, because the data quality was already sufficient in the 2SH case. Glx, glutamate + glutamine; NAAG, N-acetylaspartylglutamic acid; tNAA, NAA + N-acetyl-aspartyl-glutamate
