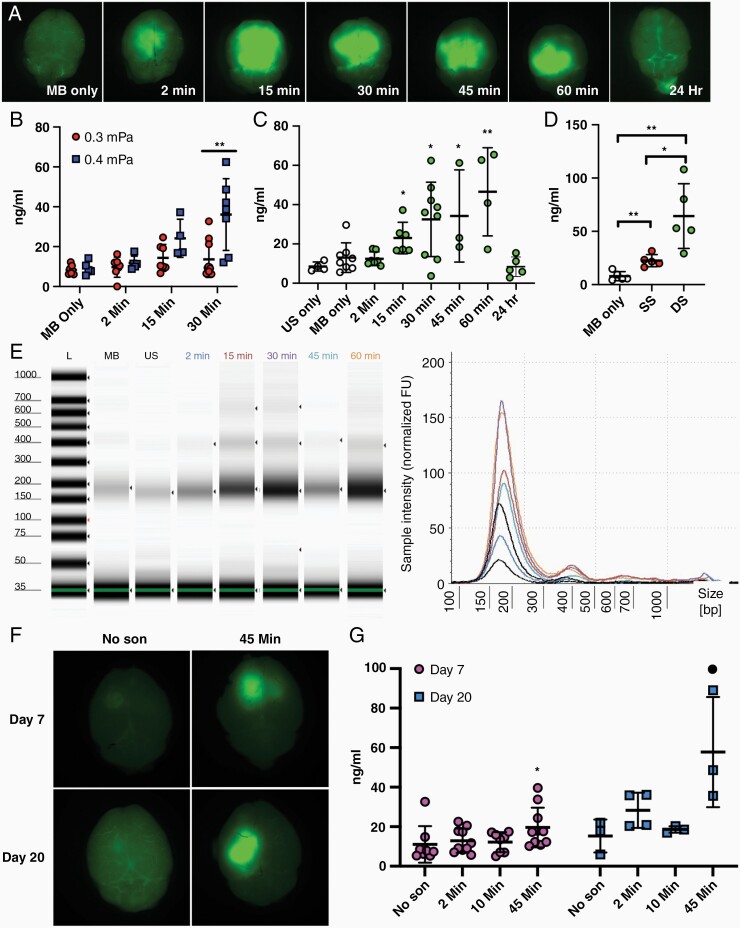
Figure 1.
(A) Representative images of fluorescein visualization of BBB opening following US and MB treatment compared to mice injected with MB alone. Brains were harvested after blood collection at time shown and imaged with Nikon AZ100 microscope with FITC filter cube. Mice in 24-hour time group had fluorescein injected 30 minutes prior to blood collection the day after sonication. (B–D) Plasma cfDNA concentration following sonication. Blood samples were collected via terminal cardiac puncture (0.5–1.0 mL) which yielded 200–500 µL of plasma. Plasma was separated from blood using a double centrifugation protocol with soft deceleration (1600 g for 10 minutes followed by 16,000 g for 10 minutes). cfDNA was isolated using Thermofisher MagMax cfDNA isolation kit according to manufacturer instructions. (B,C) cfDNA concentrations in plasma was determined fluorometrically using Qubit High sensitivity dsDNA assay or by (D) digital droplet PCR determination of HBB1 copy number and converted to ng/mL. Data plotted are mean ± standard deviation, each circle represents 1 animal. Student’s 2-tailed T-test was used to determine significance. (B) Average cfDNA concentration increases with acoustic pressure for US-mediated BBB opening at 45 minutes (**P = .0038). (C) Average cfDNA concentration begins to increase at 15 minutes following US-mediated BBB opening at 0.4 mPa and remains elevated at 60 minutes post sonication before returning to baseline levels 24 hours following sonication. (*P = .0341; *P = .016; *P = .0379; **P = .0027). (D) Average cfDNA release induced by US-mediated BBB opening increases in dose-dependent manner. Blood samples were collected 30 minutes post-sonication treatment. SS, Single Sonication; DS, Double sonication (**P = .0017; *P = .016; **P = .0034). (E) Isolated cfDNA samples display characteristic cfDNA fragment ladder pattern with peaks between 150 and 200 bp. Two cfDNA samples from each experimental condition were analyzed using Agilent Cell-free Screen Tape assay run on Agilent 4150 Instrument. MB, Microbubble only; US, Ultrasound only. (F) Representative images of fluorescein visualization of BBB opening in PF8 intracranial tumor model at day 7 and day 20 post intracranial tumor implantation. (G) Average cfDNA levels following sonication in PF8 tumor model reveal cfDNA is increased 45 minutes following sonication compared to non-sonicated mice at day 7 and day 20 post intracranial injection (*P = .040;• P = .032).

