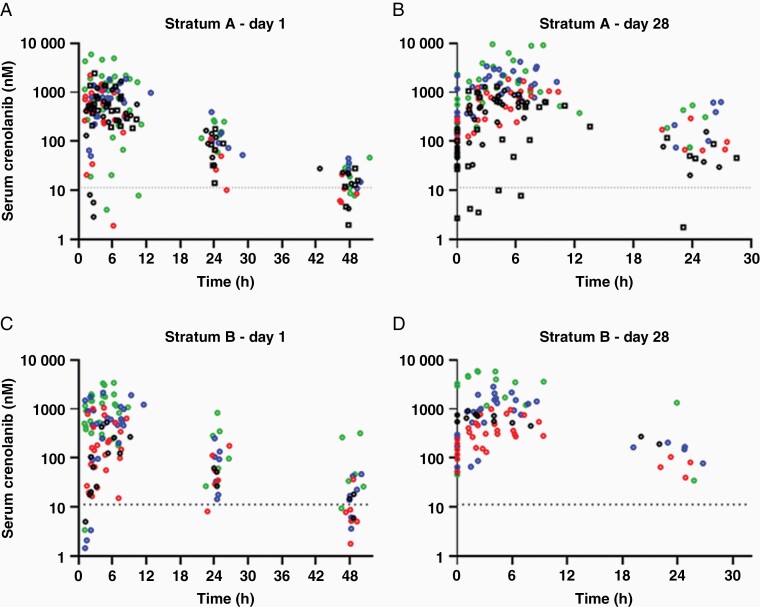
Figure 2.
Crenolanib serum concentration–time data in strata A (newly diagnosed DIPG) and B (recurrent HGG) after a single dose on day 1 (A and C) and at steady state on day 28 (B and D). The black, red, blue, and green dots represent individual data for doses of 100, 130, 170, and 220 mg/m2 of crenolanib, respectively. In panels A and B, the black squares represent data from patients in stratum A2 who took crushed tablets and the black dots represent data from patients in stratum A1 who took whole tablets. In all panels, the dotted line is the lower limit of quantification (5 ng/mL = 11.3 nM).

