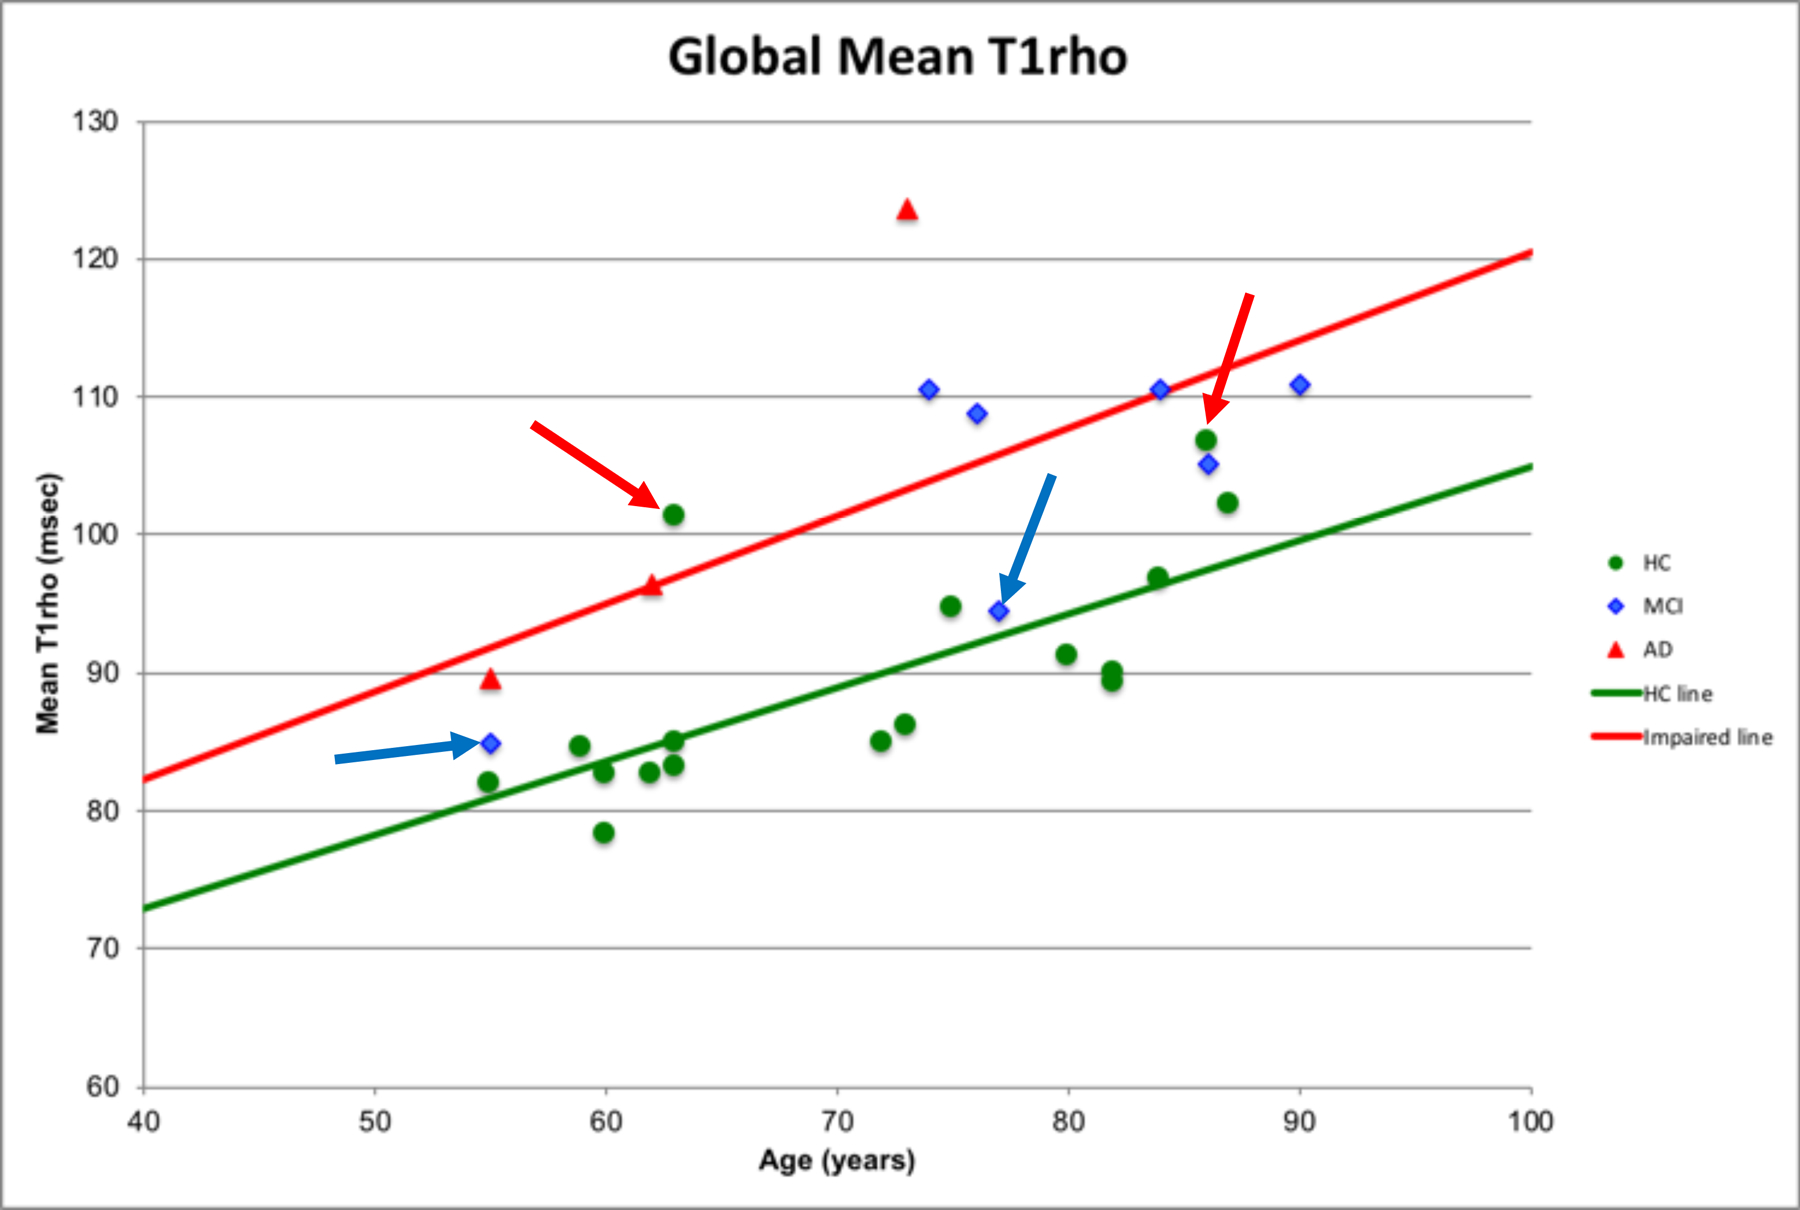
Figure 1.

The relationship between global mean T1rho (msec) and Age (years) by cognitive status. Normal cognition (healthy controls (HC)) (green line): Mean global T1rho = 51.6 + 0.53 × Age (R2 = 0.51, p = 0.0014). Impaired cognition (MCI and AD): Mean global T1rho = 56.8 + 0.64 × Age (R2 = 0.44, p = 0.036). Red arrows highlight HC participants with T1rho values more consistent with cognitive impairments and blue arrows highlight MCI participants with T1rho values more consistent with HCs.
