
Figure 2.
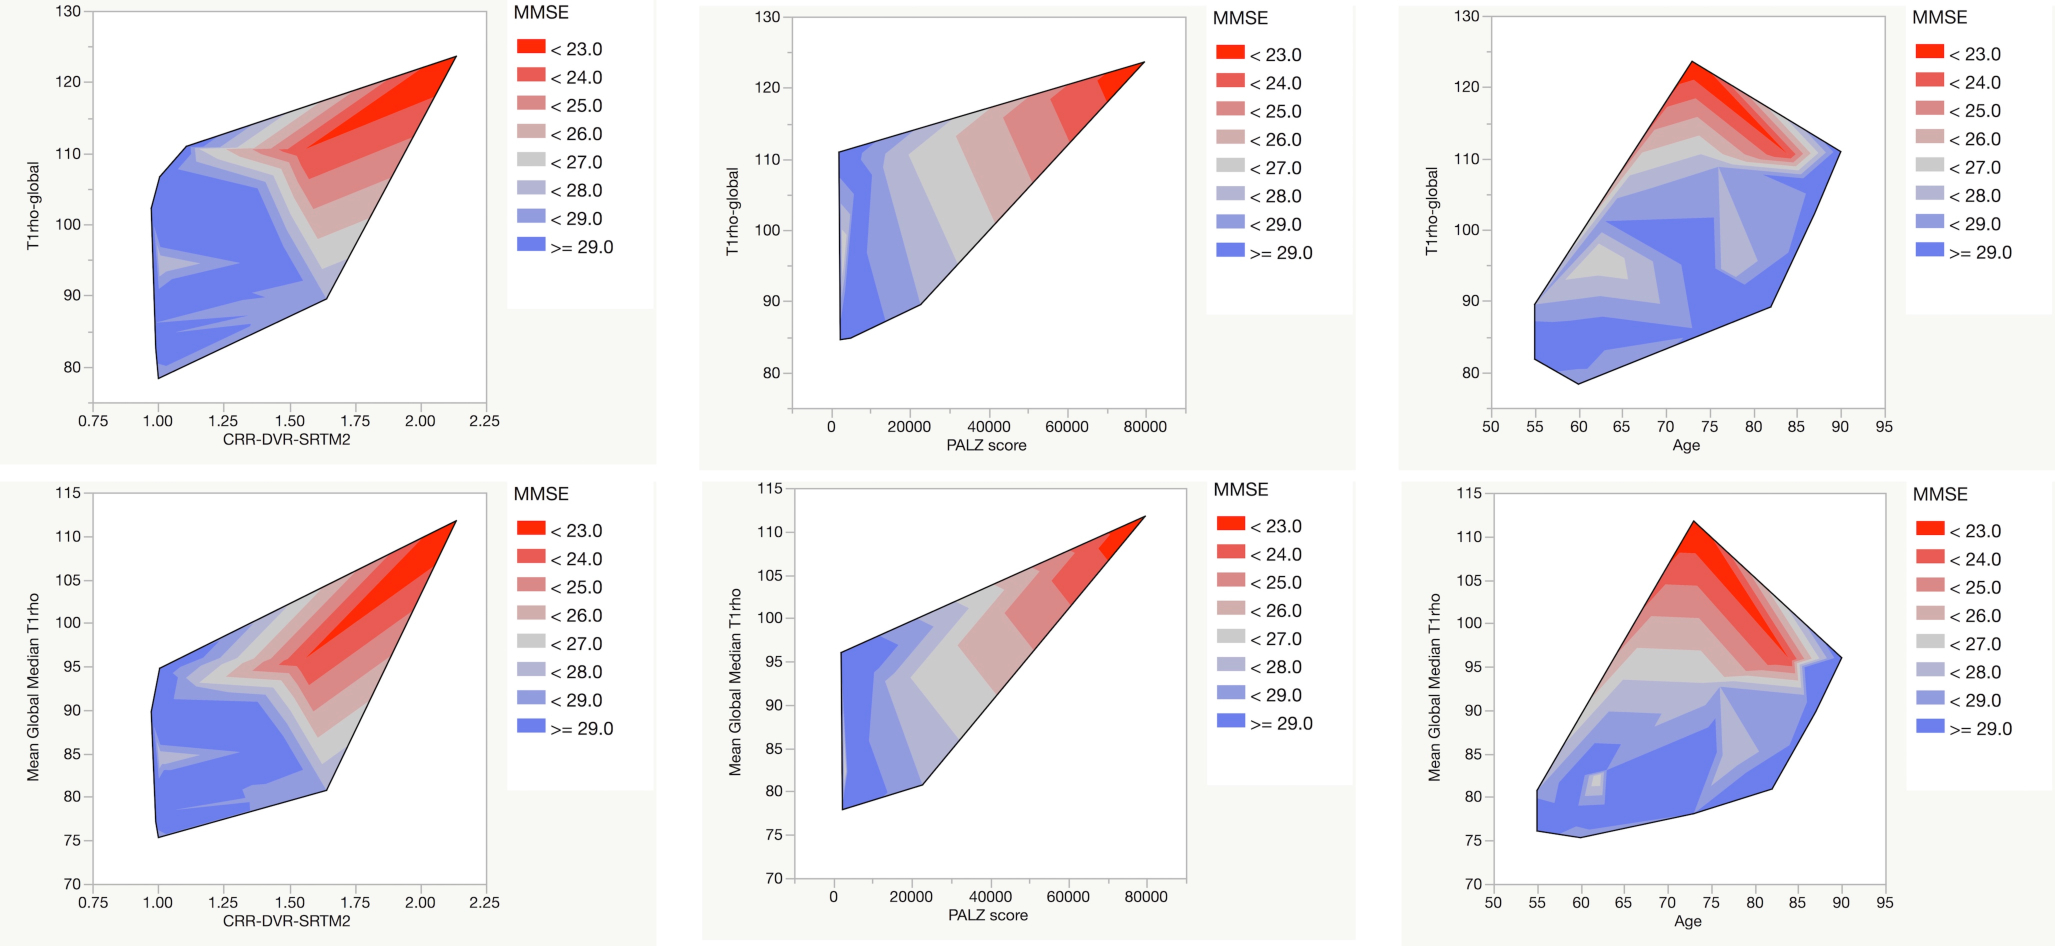
Contour plots of T1rho – global (global volume-weighted mean of regional mean values) (upper row) and mean global median T1rho (global volume-weighted mean of regional median values) (lower row) versus amyloid burden (expressed as the cortical retention ratio calculated from the DVR) (left column), FDG-based Alzheimer’s discrimination score (from PMOD PALZ) (middle column), and age (in years) contoured by Mini-Mental Status Exam score (MMSE) (red<gray<blue). Note the trend toward higher T1rho with lower MMSE (red) in all plots with corresponding higher amyloid burden (higher CRR) and more aberrant glucose metabolism (higher PALZ score) but not necessarily higher age.