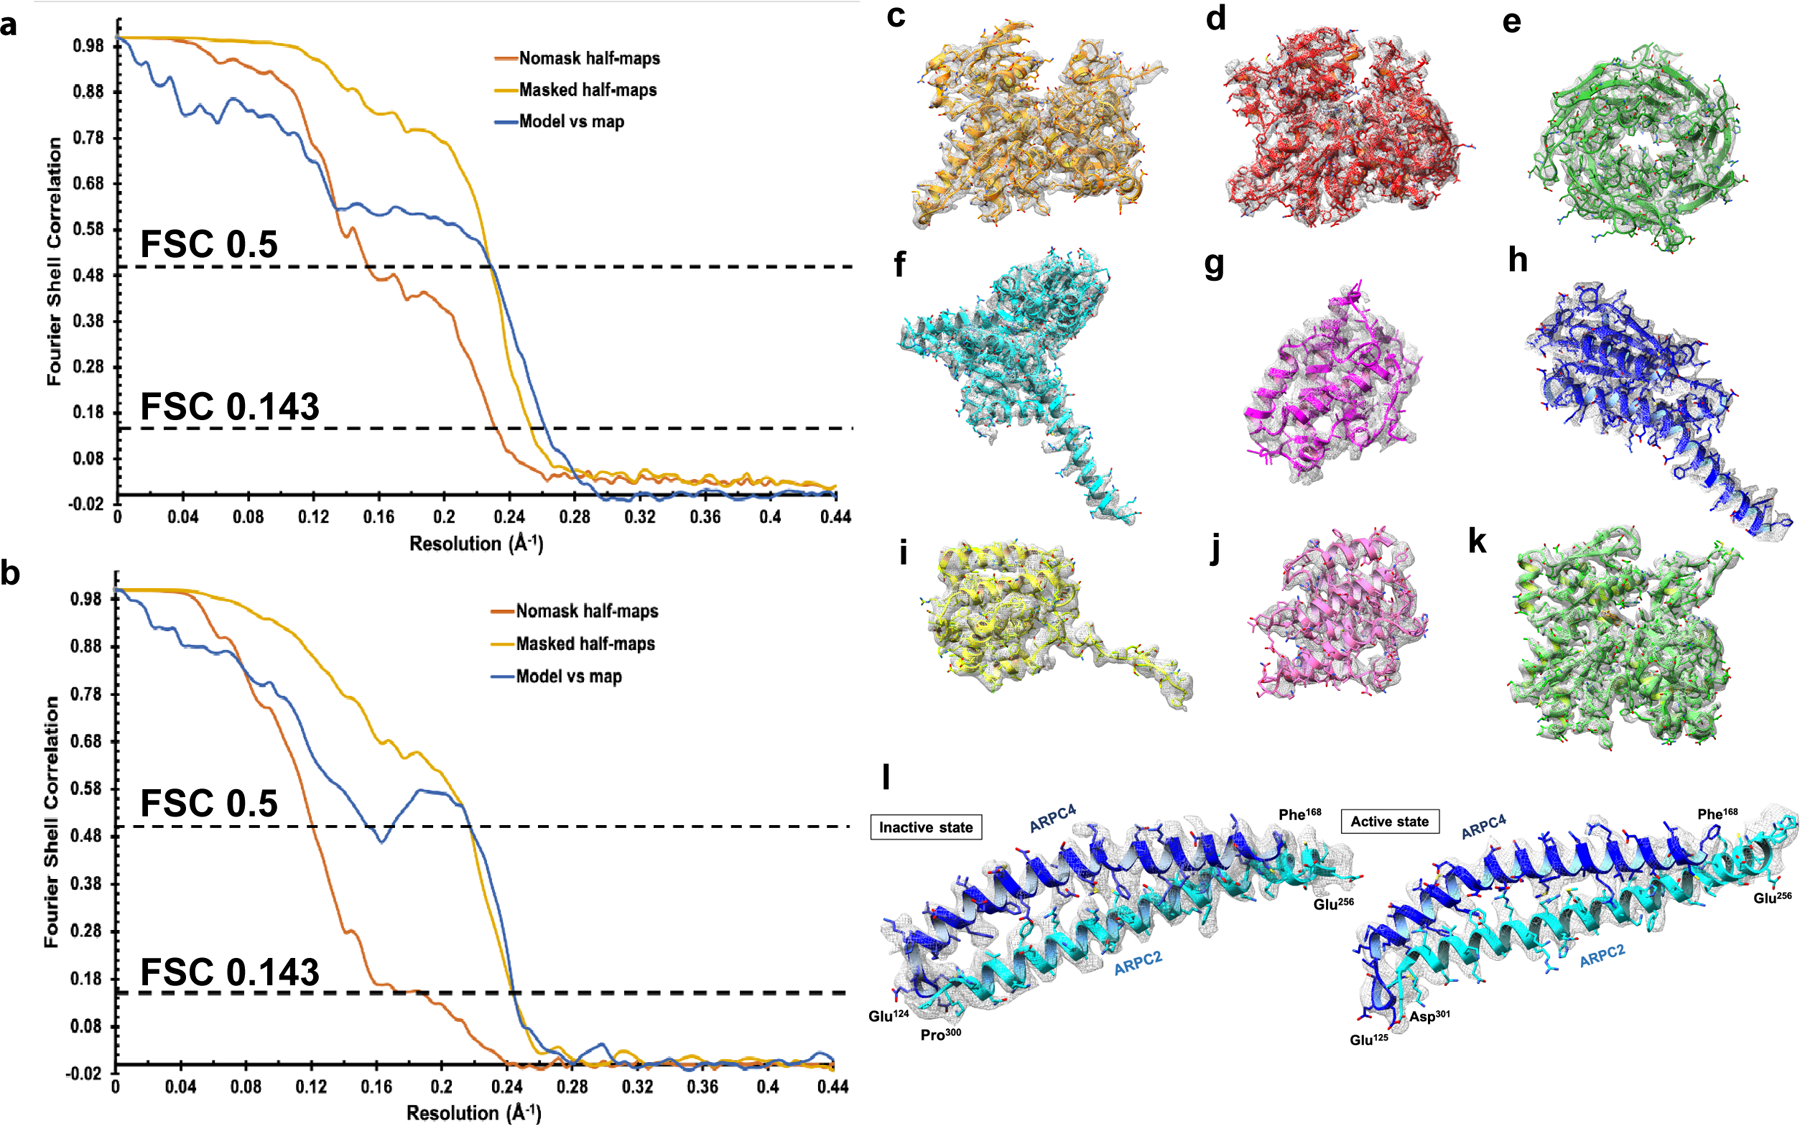
Extended Data Fig. 3|. Reconstructed maps and atomic models of subunits.

Fourier shell correlation (FSC) plots between masked (yellow) and unmasked (orange) half maps, and final map and model (blue) for global resolution estimates for a, Dip1–Arp2/3–actin-filament complex, and b, inactive Arp2/3 complex. EM density for each subunit is shown as gray mesh. c, Arp3, d, Arp2, e, ARPC1, f, ARPC2, g, ARPC3, h, ARPC4, i, ARPC5, j, Dip1, and k, actin maps with built models. l, Maps and models corresponding to the long helices from the “clamp” subunits, ARPC2 (cyan) and ARPC4 (blue) in the inactive state (left) and active state (right).
