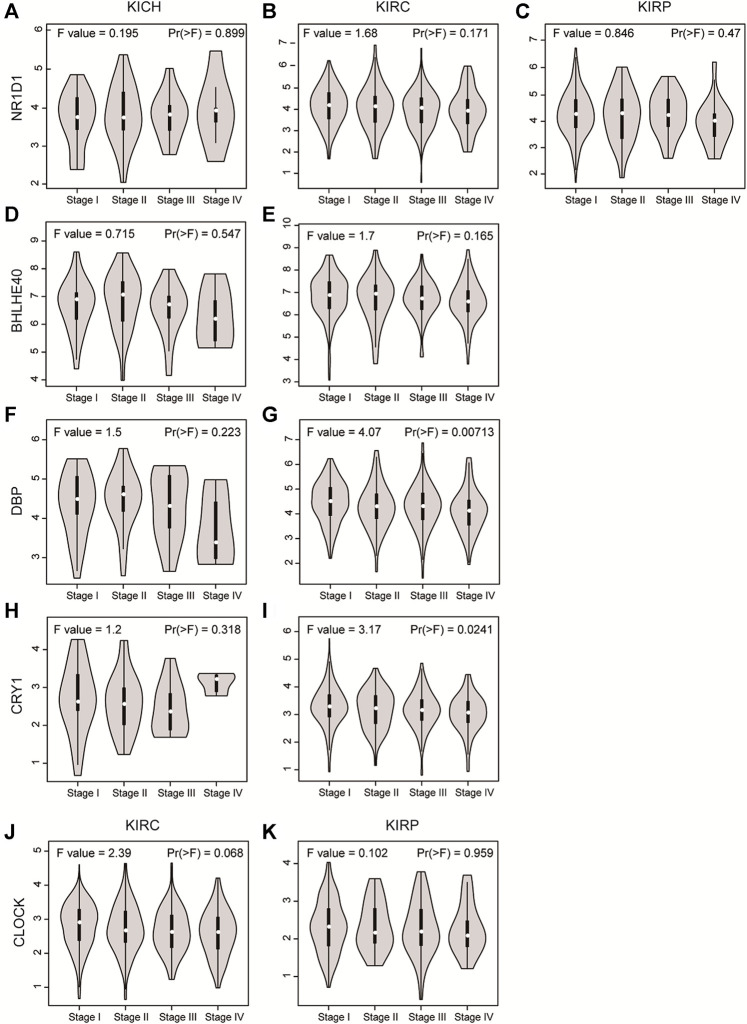
FIGURE 3.
The violin plot showed the expression level of NR1D1, BHLHE40, DBP, CRY1 and CLOCK in different stages of pan-RCC. (A–C) NRID1 expression in the stage of pan-RCC. (D,E) BHLHE40 expression in the stage of KICH and KIRC. (F,G) DBP expression in the stage of KICH and KIRC. (H,I) CRY1 expression in the stage of KICH and KIRC. (J,K) CLOCK expression in the stage of KICH and KIRC. The parameters were listed in the upper.

