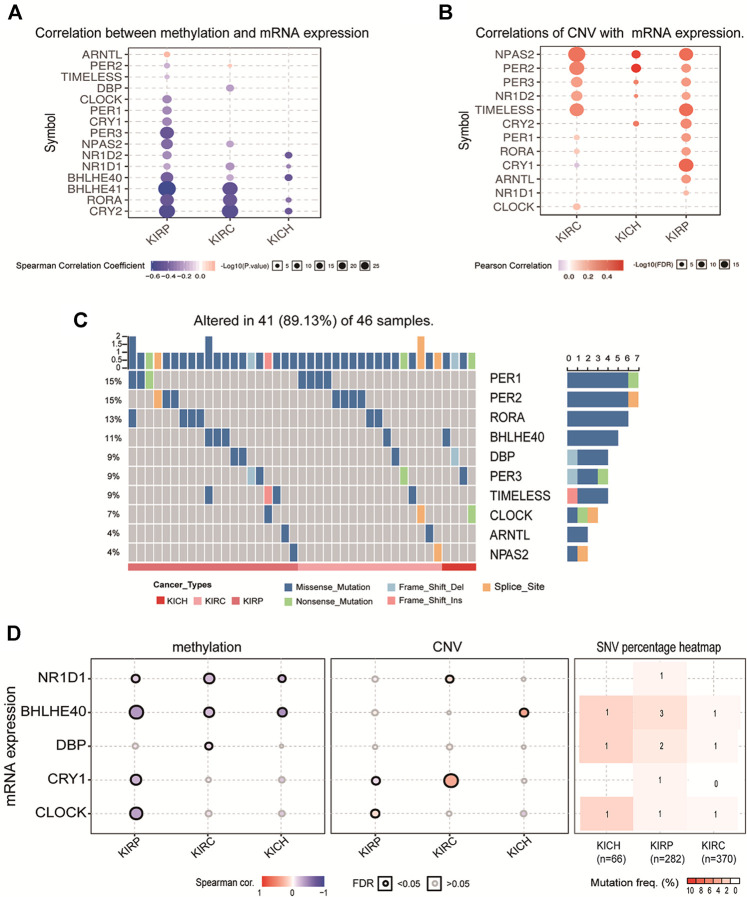
FIGURE 5.
The methylation level, CNV and mutation of clock control genes in pan-RCC. (A) Correlation between methylation and mRNA expression in pan-RCC. Here, the blue dots indicate a negative correlation of methylation with mRNA expression, pink dots represent positive correlation, and larger dots confirmed stronger methylation correlation with mRNA expression. (B) Correlation of CNV with mRNA expression in pan-RCC. The darker the pink dot indicates a stronger correlation of CNV associated with mRNA expression. FDR<0.05. (C) The mutation distribution of rhythm genes in pan-RCC. Here, the columns represent the number of case mutations in patient rhythmic genes, the rows represent rhythmic genes, and the color bars below the figure represent three different types of renal cancer. (D) The methylation level, CNV, and mutation of five key differentially expressed genes.

