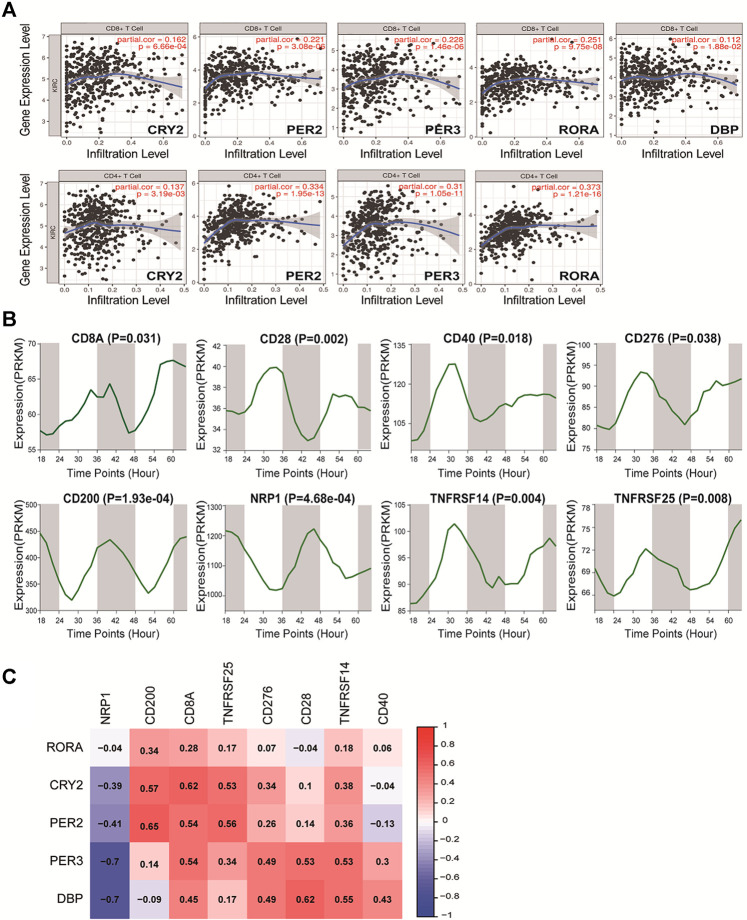
FIGURE 7.
Correlation of five prognostic core clock genes with immune infiltration. (A) The five prognostic core clock genes were correlated with CD8 T cells and CD4 T cells. The abscissa represent the infiltration level and the ordinate represent the gene expression level. (B) The rhythmic expression patterns of eight immune cell markers at different time intervals in mice renal tissue (Mus GSE54652). (C) The expression of five prognosis clock control genes was associated with the expression of these key immune genes. Here, columns represent key immune genes and rows represent clock genes, red represents positive correlation between rhythm genes and immune genes, and blue represents negative correlation between rhythm genes and immune genes.

