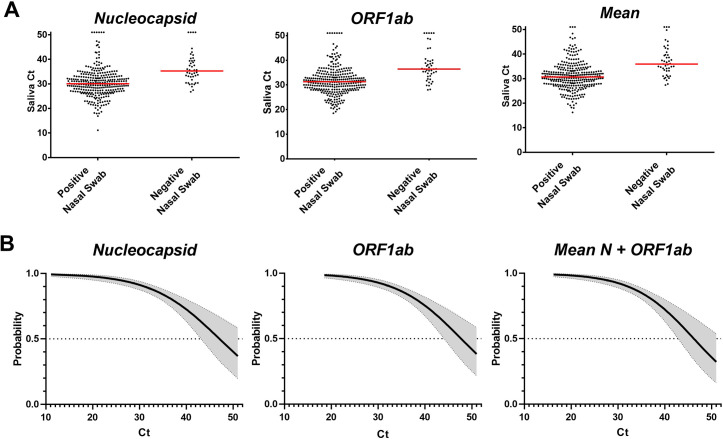
Fig 2. Association between saliva test Ct value and subsequent diagnosis of COVID-19.
A) Ct values for two SARS-CoV-2 genes, ‘N’ and ‘ORF1ab,’ as well as their mean Ct and subsequent diagnostic result following re-test referral. Median saliva Ct values were significantly lower (p<0.0001) for those testing positive by nasal swab. Each dot represents 1 participant sample. Genes which amplified within 50 cycles, but did not cross the threshold, were assigned a Ct value of 51 for post-hoc analysis. B) Probability of a subsequent positive diagnosis based on saliva Ct value was calculated using a logistic regression model. 95% confidence intervals are shown in gray on each side of the best fit line.

