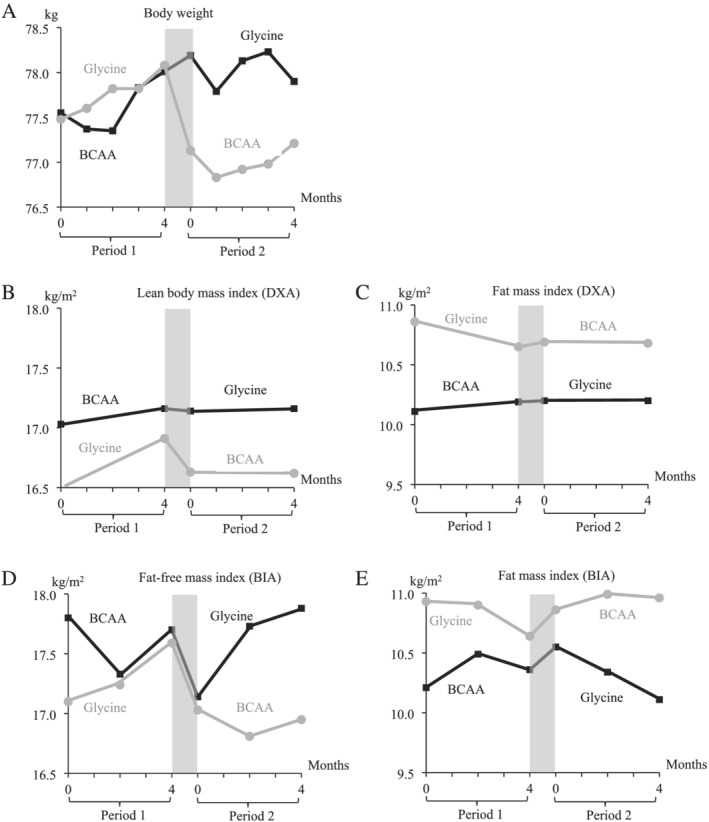
Figure 1.

Line plot showing the evolution of (A) weight (kg), (B) lean body mass index (kg/m2), (C) fat mass index (DXA), (D) fat‐free mass index (kg/m2/day), and (E) fat mass index (BIA) (kg) in the BCAA–glycine group (black squares and line) and in the glycine–BCAA group (grey dots and line). The grey zone indicates the washout period, which occurred for each patient between Months 4 and 5.
