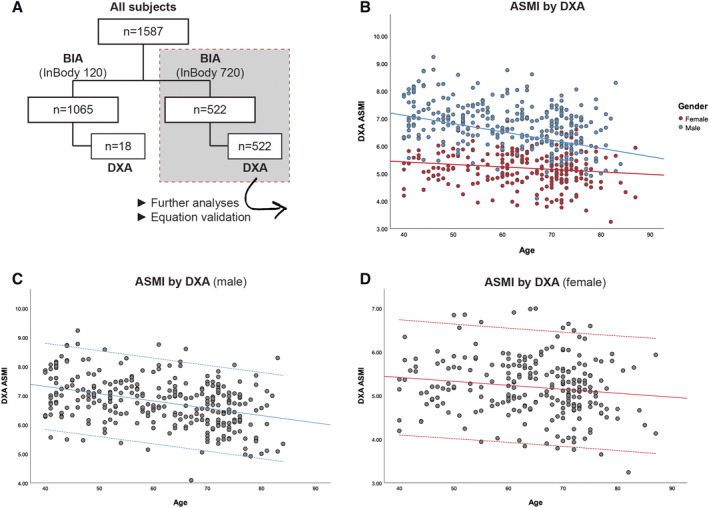
Figure 3.

Appendicular skeletal muscle mass (ASMI, kg/m2) as evaluated by dual‐energy X‐ray absorptiometry (DXA). Top and bottom lines on (C) and (D) indicate ±1.96 SD. (A) Flow chart showing the breakdown of different tests and number of subjects in each dataset. (B) ASMI vs. age coloured by gender (n = 540). (C) Male DXA ASMI vs. age (n = 299). (D) Female DXA ASMI vs. age (n = 241). BIA, bioimpedance analysis.
