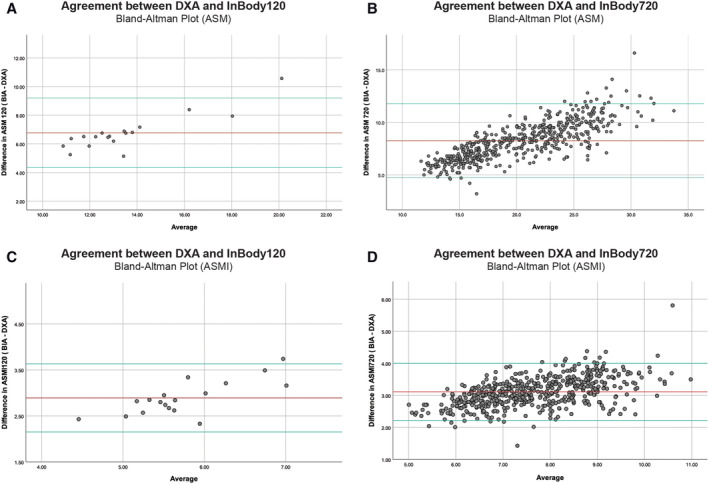
Figure 5.

Bland–Altman plot comparing appendicular skeletal muscle mass (ASM) and appendicular skeletal muscle mass index (ASMI) measured between bioimpedance analysis (BIA) and dual‐energy X‐ray absorptiometry (DXA) in Dataset120 (n = 18) and Dataset720 (n = 522). Top and bottom reference lines indicate 95% confidence interval. (A) ASM mean difference = 6.77 ± 1.24 kg, limits of agreement = 4.35, 9.20. (B) ASM mean difference = 8.25 ± 1.80 kg, limits of agreement = 4.73, 11.77. (C) ASMI mean difference = 2.89 ± 0.38 kg/m2, limits of agreement = 2.15, 3.63. (D) ASMI mean difference = 3.11 ± 0.45 kg/m2, limits of agreement = 2.22, 4.00.
