
Figure 1.
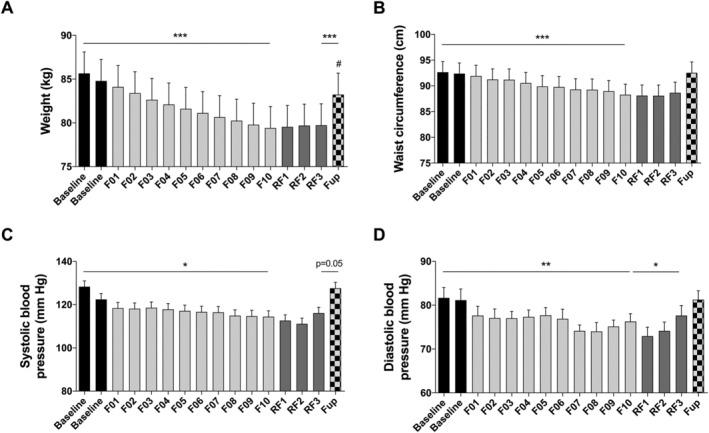
Changes in body weight (A), waist circumference (B), systolic (C), and diastolic (D) blood pressures before and during the 10 day fasting (n = 16) and after 3 months of Fup (n = 15). Data are lsmeans ± SE. F, fasting days; Fup, follow‐up; RF, food reintroduction days. *P < 0.05, **P < 0.01, ***P < 0.001 as indicated by the lines for the whole effect of fasting, the whole effect of RF or the effect of Fup vs. the end of fasting. #P < 0.05 vs. baseline during Fup.