Figure 3.

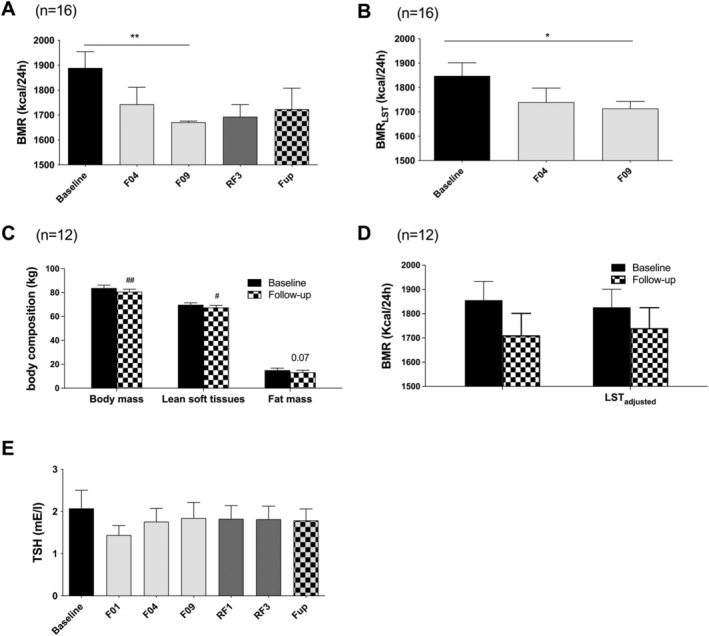
Changes in raw BMR (A) and BMR adjusted on LST calculated from changes in urinary nitrogen excretion (B) on 16 subjects during the whole fasting and 15 subjects at Fup. The figure also reports the changes in body composition assessed by impedancemetry at baseline and Fup (n = 12 subjects, C) used to adjust BMR at Fup (D). TSH concentrations are presented on panel (E). Data are lsmeans ± SE. BMR, basal metabolic rate; F, fasting days; Fup, follow‐up; LST, lean soft tissues; RF, food reintroduction days, TSH, thyroid stimulated hormone. *P < 0.05, **P < 0.01 as indicated by the lines for the whole effect of fasting, the whole effect of RF or the effect of Fup vs. the end of fasting. #P < 0.05, ##P < 0.01 vs. baseline.
