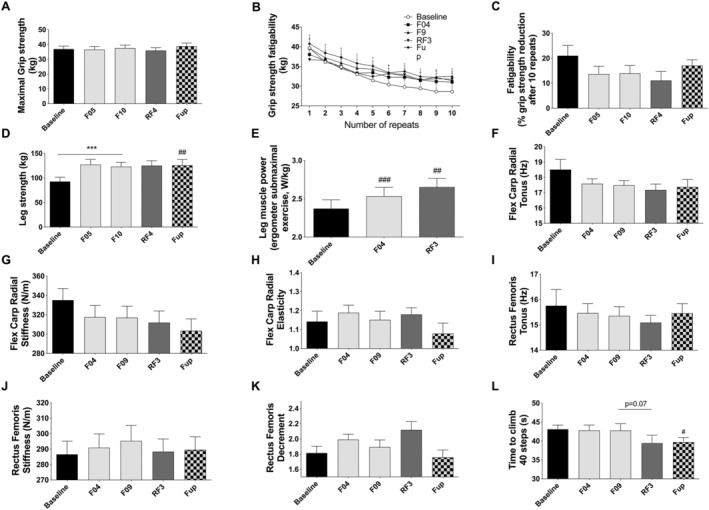
Figure 4.

Changes in maximal grip strength (A) and fatigability expressed in kg after 10 repeats (B) or as a percent of strength reduction after 10 repeats (C), leg strength (D), leg power during a submaximal exercise on an ergometer (E), skeletal muscle flexor carpi radialis tonus (F), stiffness (G) and decrement (H), rectus femoris tonus (I), stiffness (J) and decrement (K), and time to climb 40 steps (L) before and during the 10 day fasting (n = 16) and after 3 months of Fup (n = 15). Data are lsmeans ± SE. F, fasting days; Fup, follow‐up; RF, food reintroduction days. ***P < 0.001 as indicated by the lines for the whole effect of fasting, the whole effect of RF or the effect of Fup vs. the end of fasting. #P < 0.05, ##P < 0.01, ###P < 0.001 vs. baseline.
