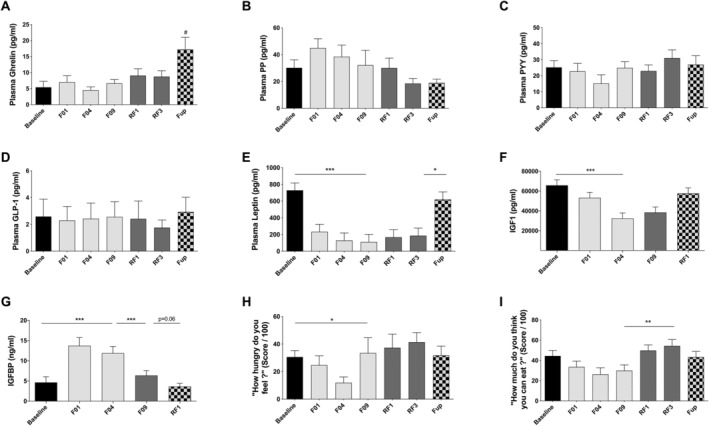
Figure 7.

Changes in plasma ghrelin (A), plasma PP (B), PYY (C), GLP‐1 (D), leptin (E), IGF1 (F), IGFBP1 (G), and two question on satiety derived from visual scale: ‘how hungry do you feel’ (H) and ‘how much do you think you can eat’ (I) before and during the 10 day fasting (n = 16) and after 3 months of Fup (n = 15). Data are lsmeans ± SE. F, fasting days; Fup, follow‐up; GLP‐1, glucagon like peptide 1; IGF1, insulin growth factor 1; IGFBP1, insulin growth factor binding protein; PYY, polypeptide YY; RF, food reintroduction days. *P < 0.05, **P < 0.01, ***P < 0.001 as indicated by the lines for the whole effect of fasting, the whole effect of RF or the effect of Fup vs. the end of fasting. #P < 0.05 vs. baseline during Fup.
