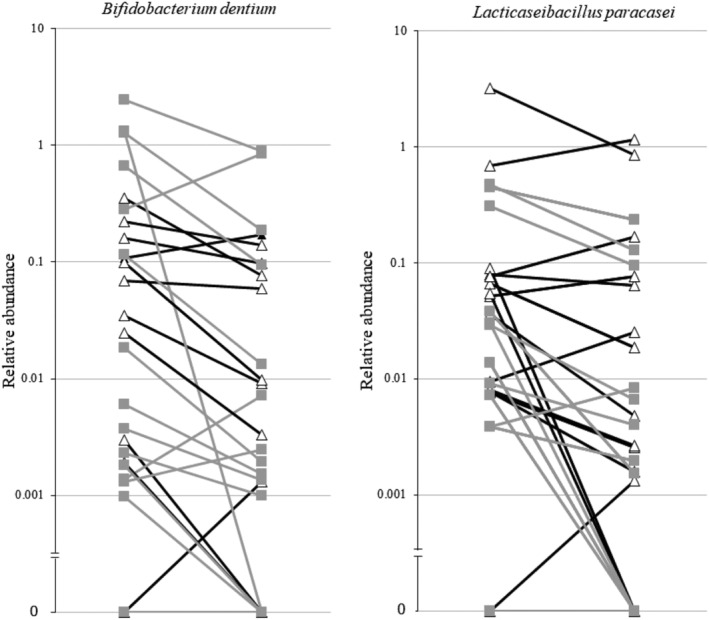
Figure 4.

Line plots showing the decrease of the relative abundance of Bifidobacterium dentium and Lacticaseibacillus paracasei, between Months 0 and 4, under branched‐chain amino acid (BCAA). Black lines represent the group treated first with BCAA in the first 4 months of the study and the grey lines the group treated with BCAA in the second 4 months of the study.
